
MARKET-BEATING SCORE = 2/10
BETA | Beta Technologies, Inc.
"is an electric aerospace company focused on designing, manufacturing, and selling high-performance aircraft, propulsion systems, and charging systems. The firm designs and manufactures the ALIA, a family of electric aircraft with a conventional takeoff and landing (CTOL) and vertical takeoff and landing (VTOL) variant."
HQ in: South Burlington, VT.
------------------------------
BULL CASE — +25%
Strong revenue growth (73%) supports market-beating returns.
High gross margin (72.2%) signals strong moat — characteristic of long-run market beaters.
Negative FCF — cash burn is a risk factor against market-beating returns.
BEAR CASE — −25%
Net losses burning cash — equity value erodes through any drawdown.
Negative FCF: capital markets disruption could accelerate a −25% event.
-------------------------
Multiple Time-Frame Analysis; Color Code | Strength favors the higher timeframe.
Yearly timeframe = black
Monthly timeframe = pink
weekly = grey
daily = red
4hr = orange
1hr = yellow
15min = blue
5min = green if they are shown. (Level visibility on intervals is set to timeframe the level was found on and below to keep chart view organized.)
** Candle Science explained **
A Range = two or more consecutive color candles.
There are two types of ranges - accumulation and distribution.
DISTRIBUTION RANGES DEFINED: BackSide (BS) Candle - First distribution candle in a distribution range. Expectation = strong reaction to price. long wicks reaching to or away from level.
FrontSide (FS) Candle - Last distribution candle in a distribution range. Expectation = reversal, create a trend in the opposite direction. Distribution candles are used as support.
ACCUMULATION RANGES DEFINED:
Inverse BS (Inv.BS) - First Accumulation candle in an accumulation range. Expectation. = strong reaction to price. long wicks reaching to or away from level.
Inverse FS (Inv.FS) - Last accumulation candle in an accumulation range. Expectation = reversal, create a trend in the opposite direction. Accumulation candles are used as resistance.
Horizontal Ray tool on BS & FS levels are default support levels when dashed lines, tested when dotted lines and resistance when solid lines.
Horizontal Ray tool on Inverse BS & Inverse FS levels default as resistance and shown with a dashed line, tested when 1x dotted line, and support when solid line.
The inverse is true for the Inv. BS Inv. FS levels, they are resistance as dashed lines, tested as dotted and support as solid lines.
BETA | Beta Technologies, Inc.
"is an electric aerospace company focused on designing, manufacturing, and selling high-performance aircraft, propulsion systems, and charging systems. The firm designs and manufactures the ALIA, a family of electric aircraft with a conventional takeoff and landing (CTOL) and vertical takeoff and landing (VTOL) variant."
HQ in: South Burlington, VT.
------------------------------
BULL CASE — +25%
Strong revenue growth (73%) supports market-beating returns.
High gross margin (72.2%) signals strong moat — characteristic of long-run market beaters.
Negative FCF — cash burn is a risk factor against market-beating returns.
BEAR CASE — −25%
Net losses burning cash — equity value erodes through any drawdown.
Negative FCF: capital markets disruption could accelerate a −25% event.
-------------------------
Multiple Time-Frame Analysis; Color Code | Strength favors the higher timeframe.
Yearly timeframe = black
Monthly timeframe = pink
weekly = grey
daily = red
4hr = orange
1hr = yellow
15min = blue
5min = green if they are shown. (Level visibility on intervals is set to timeframe the level was found on and below to keep chart view organized.)
** Candle Science explained **
A Range = two or more consecutive color candles.
There are two types of ranges - accumulation and distribution.
DISTRIBUTION RANGES DEFINED: BackSide (BS) Candle - First distribution candle in a distribution range. Expectation = strong reaction to price. long wicks reaching to or away from level.
FrontSide (FS) Candle - Last distribution candle in a distribution range. Expectation = reversal, create a trend in the opposite direction. Distribution candles are used as support.
ACCUMULATION RANGES DEFINED:
Inverse BS (Inv.BS) - First Accumulation candle in an accumulation range. Expectation. = strong reaction to price. long wicks reaching to or away from level.
Inverse FS (Inv.FS) - Last accumulation candle in an accumulation range. Expectation = reversal, create a trend in the opposite direction. Accumulation candles are used as resistance.
Horizontal Ray tool on BS & FS levels are default support levels when dashed lines, tested when dotted lines and resistance when solid lines.
Horizontal Ray tool on Inverse BS & Inverse FS levels default as resistance and shown with a dashed line, tested when 1x dotted line, and support when solid line.
The inverse is true for the Inv. BS Inv. FS levels, they are resistance as dashed lines, tested as dotted and support as solid lines.
トレード稼働中
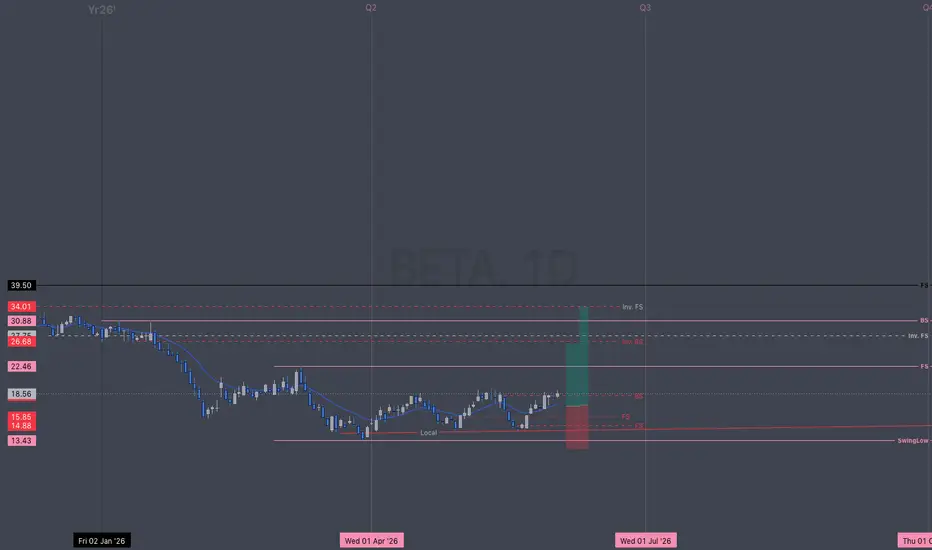
Beta leaving behind daily support at $18.64 area (top of distribution candle created July 24 is the last daily FrontSide candle in the support range created. Price action is now encountering all the R.A.T's sitting on that monthly FrontSide Support level at $22.46 using the Rejection As a Target to scalp and take profit. If price can gain the Monthly support, it will try to break out of the range above the BackSide support at $30.88

免責事項
これらの情報および投稿は、TradingViewが提供または承認する金融、投資、取引、またはその他の種類の助言もしくは推奨であることを意図したものではなく、またこれらに該当するものでもありません。詳細は利用規約をご覧ください。
免責事項
これらの情報および投稿は、TradingViewが提供または承認する金融、投資、取引、またはその他の種類の助言もしくは推奨であることを意図したものではなく、またこれらに該当するものでもありません。詳細は利用規約をご覧ください。