
📊 Key Technical Indicators
Relative Strength Index (RSI): 47.96 – Neutral, indicating neither overbought nor oversold conditions.
MACD: 6.55 – Strong bearish, suggesting downward momentum.
Average Directional Index (ADX): 17.09 – Neutral, indicating a weak trend.
Super Trend: ₹1,870.13 – Mild bullish, suggesting a slight upward trend.
Williams %R: -67.16 – Neutral, indicating no extreme overbought or oversold conditions.
Commodity Channel Index (CCI): -1.48 – Neutral, suggesting no strong trend.
📈 Moving Averages Analysis
Exponential Moving Averages (EMA):
5-period: ₹1,924.98 – Strong bearish.
15-period: ₹1,924.34 – Strong bearish.
50-period: ₹1,913.43 – Strong bearish.
100-period: ₹1,884.82 – Mild bullish.
Simple Moving Averages (SMA):
5-period: ₹1,927.04 – Mild bullish.
15-period: ₹1,925.39 – Mild bullish.
50-period: ₹1,909.92 – Mild bullish.
200-period: ₹1,792.48 – Mild bullish.
The alignment of moving averages indicates a generally bullish sentiment in the short term.
🔄 Trend and Volume Insights
Trend: The stock is exhibiting a mild bullish trend, supported by the Super Trend indicator and the alignment of moving averages.
Volume: An increase in trading volume could confirm the strength of the current trend.
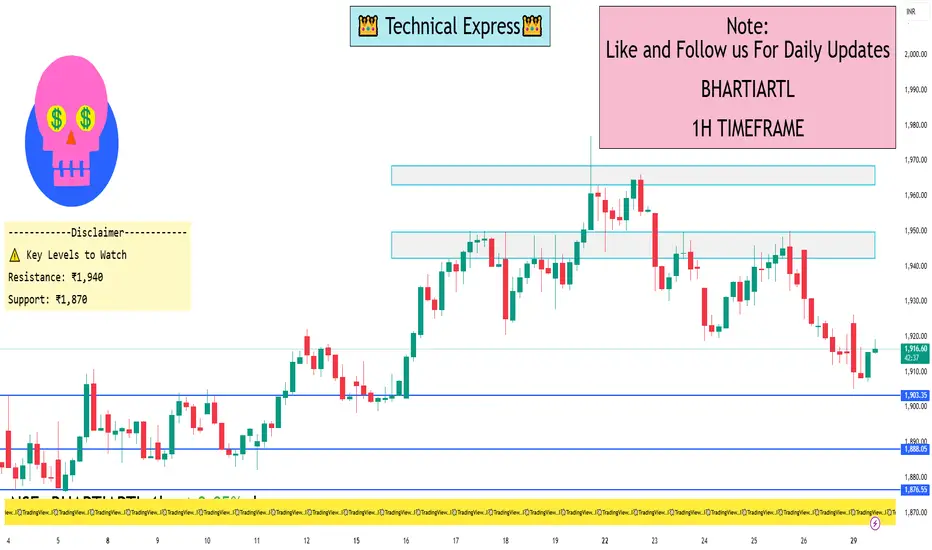
⚠️ Key Levels to Watch
Resistance: ₹1,940 – a potential barrier if the stock continues its upward movement.
Support: ₹1,870 – a level to watch for potential price rebounds.
✅ Summary
Bharti Airtel Ltd. is currently in a mild bullish phase on the 1-hour timeframe, with supportive indicators and moving averages. However, the ADX suggests weak trend strength, indicating potential consolidation. Traders should monitor key levels and volume changes for confirmation of trend continuation.
Relative Strength Index (RSI): 47.96 – Neutral, indicating neither overbought nor oversold conditions.
MACD: 6.55 – Strong bearish, suggesting downward momentum.
Average Directional Index (ADX): 17.09 – Neutral, indicating a weak trend.
Super Trend: ₹1,870.13 – Mild bullish, suggesting a slight upward trend.
Williams %R: -67.16 – Neutral, indicating no extreme overbought or oversold conditions.
Commodity Channel Index (CCI): -1.48 – Neutral, suggesting no strong trend.
📈 Moving Averages Analysis
Exponential Moving Averages (EMA):
5-period: ₹1,924.98 – Strong bearish.
15-period: ₹1,924.34 – Strong bearish.
50-period: ₹1,913.43 – Strong bearish.
100-period: ₹1,884.82 – Mild bullish.
Simple Moving Averages (SMA):
5-period: ₹1,927.04 – Mild bullish.
15-period: ₹1,925.39 – Mild bullish.
50-period: ₹1,909.92 – Mild bullish.
200-period: ₹1,792.48 – Mild bullish.
The alignment of moving averages indicates a generally bullish sentiment in the short term.
🔄 Trend and Volume Insights
Trend: The stock is exhibiting a mild bullish trend, supported by the Super Trend indicator and the alignment of moving averages.
Volume: An increase in trading volume could confirm the strength of the current trend.
⚠️ Key Levels to Watch
Resistance: ₹1,940 – a potential barrier if the stock continues its upward movement.
Support: ₹1,870 – a level to watch for potential price rebounds.
✅ Summary
Bharti Airtel Ltd. is currently in a mild bullish phase on the 1-hour timeframe, with supportive indicators and moving averages. However, the ADX suggests weak trend strength, indicating potential consolidation. Traders should monitor key levels and volume changes for confirmation of trend continuation.

関連の投稿
免責事項
これらの情報および投稿は、TradingViewが提供または承認する金融、投資、取引、またはその他の種類の助言もしくは推奨であることを意図したものではなく、またこれらに該当するものでもありません。詳細は利用規約をご覧ください。
関連の投稿
免責事項
これらの情報および投稿は、TradingViewが提供または承認する金融、投資、取引、またはその他の種類の助言もしくは推奨であることを意図したものではなく、またこれらに該当するものでもありません。詳細は利用規約をご覧ください。