
This chart and analysis are not financial advice. Do your own research before trading or investing.
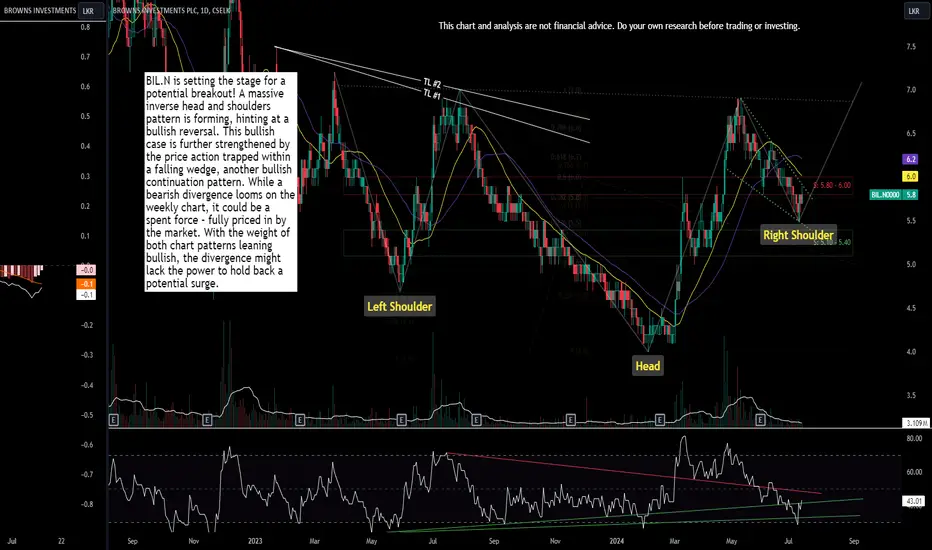
BIL.N is setting the stage for a potential breakout! A massive inverse head and shoulders pattern is forming, hinting at a bullish reversal. This bullish case is further strengthened by the price action trapped within a falling wedge, another bullish continuation pattern. While a bearish divergence looms on the weekly chart, it could be a spent force – fully priced in by the market. With the weight of both chart patterns leaning bullish, the divergence might lack the power to hold back a potential surge.
BIL.N is setting the stage for a potential breakout! A massive inverse head and shoulders pattern is forming, hinting at a bullish reversal. This bullish case is further strengthened by the price action trapped within a falling wedge, another bullish continuation pattern. While a bearish divergence looms on the weekly chart, it could be a spent force – fully priced in by the market. With the weight of both chart patterns leaning bullish, the divergence might lack the power to hold back a potential surge.

免責事項
これらの情報および投稿は、TradingViewが提供または承認する金融、投資、取引、またはその他の種類の助言もしくは推奨であることを意図したものではなく、またこれらに該当するものでもありません。詳細は利用規約をご覧ください。
免責事項
これらの情報および投稿は、TradingViewが提供または承認する金融、投資、取引、またはその他の種類の助言もしくは推奨であることを意図したものではなく、またこれらに該当するものでもありません。詳細は利用規約をご覧ください。