アップデート済
Possible Breakout Starting on Daily
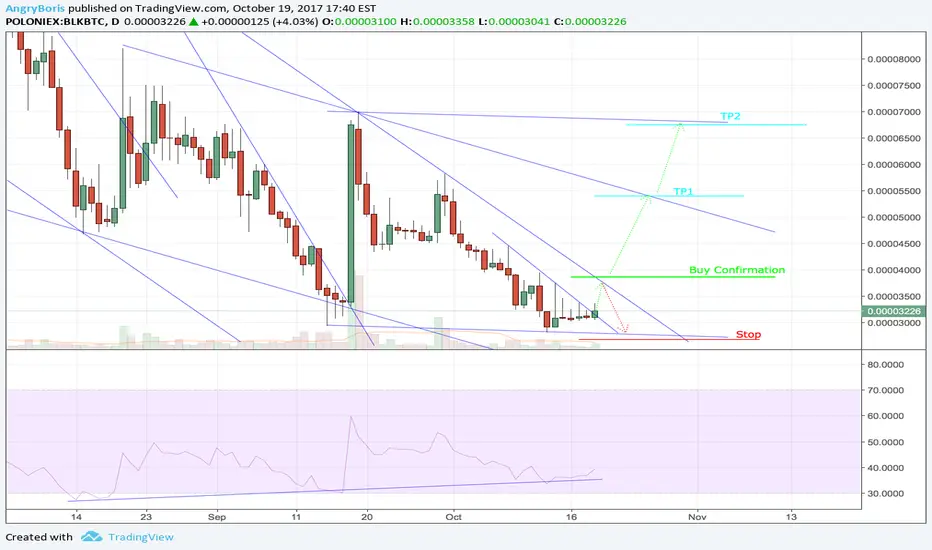
BLKBTC looks like its possibly found a bottom and is trying to break its downtrend. Bullish divergence with RSI/price could be a supporting signal of upward move. It is also breaking up out of a triangle on the daily. I drew what I perceive as a few downtrends it needs to break. I won't consider a buy until it breaks the first one right around the green line. I set a few hopeful TPs and the red line is my stop.
Buy in: 0.00003865
TP1: 0.00005400
TP2: 0.00006750
Stop: 0.00002680
Buy in: 0.00003865
TP1: 0.00005400
TP2: 0.00006750
Stop: 0.00002680
ノート
Failed to break through its current downtrend. Not quite ready for the jump. Looks like its gonna head down to lower support again at around 0.00002780 for now.ノート
Bounced off lower support and heading to top of descending triangle. Watching for breakout before buying.
**Updated positions**
Buy in: 0.00003445
TP1: 0.00004970
TP2: 0.00006680
Stop: 0.00002680

免責事項
これらの情報および投稿は、TradingViewが提供または承認する金融、投資、取引、またはその他の種類の助言もしくは推奨であることを意図したものではなく、またこれらに該当するものでもありません。詳細は利用規約をご覧ください。
免責事項
これらの情報および投稿は、TradingViewが提供または承認する金融、投資、取引、またはその他の種類の助言もしくは推奨であることを意図したものではなく、またこれらに該当するものでもありません。詳細は利用規約をご覧ください。