ロング
BLOKUSDT
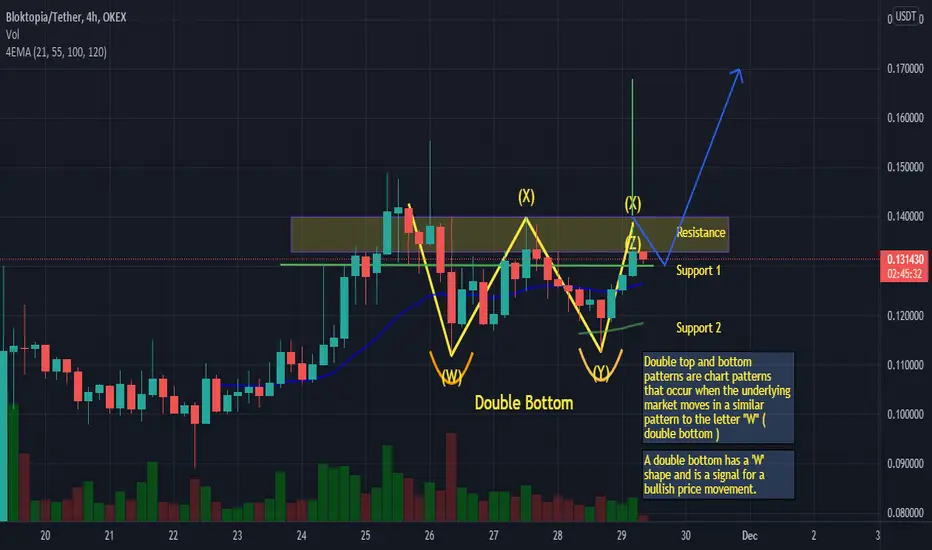
Double top and bottom patterns are chart patterns that occur when the underlying market moves in a similar pattern to the letter "W" ( double bottom )
A double bottom has a 'W' shape and is a signal for a bullish price movement.
If BLOK breaks R1 Region 0.13000-0.14000
Then
it can go to 0.17000-0.20000
A double bottom has a 'W' shape and is a signal for a bullish price movement.
If BLOK breaks R1 Region 0.13000-0.14000
Then
it can go to 0.17000-0.20000

免責事項
これらの情報および投稿は、TradingViewが提供または承認する金融、投資、取引、またはその他の種類の助言もしくは推奨であることを意図したものではなく、またこれらに該当するものでもありません。詳細は利用規約をご覧ください。
免責事項
これらの情報および投稿は、TradingViewが提供または承認する金融、投資、取引、またはその他の種類の助言もしくは推奨であることを意図したものではなく、またこれらに該当するものでもありません。詳細は利用規約をご覧ください。