
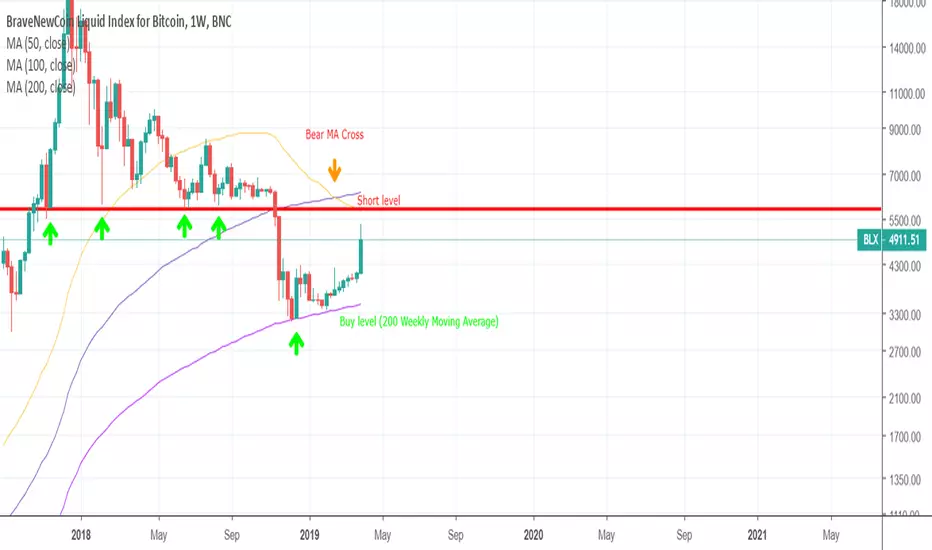
This is the Bitcoin weekly view (BLX chart).
We have seen that the 5800$ level acted as a good support until it was tested for the 5th time in november 2018. Now it is acting as huge resistance and it coincides with the 50 Weekly Moving Average, which also acts a resistance. Furthermore we have seen the bearish MA cross happen already (50 crossed down the 100). The long term support is at the 200 weekly Moving Average.
We have seen that the 5800$ level acted as a good support until it was tested for the 5th time in november 2018. Now it is acting as huge resistance and it coincides with the 50 Weekly Moving Average, which also acts a resistance. Furthermore we have seen the bearish MA cross happen already (50 crossed down the 100). The long term support is at the 200 weekly Moving Average.

免責事項
これらの情報および投稿は、TradingViewが提供または承認する金融、投資、取引、またはその他の種類の助言もしくは推奨であることを意図したものではなく、またこれらに該当するものでもありません。詳細は利用規約をご覧ください。
免責事項
これらの情報および投稿は、TradingViewが提供または承認する金融、投資、取引、またはその他の種類の助言もしくは推奨であることを意図したものではなく、またこれらに該当するものでもありません。詳細は利用規約をご覧ください。