
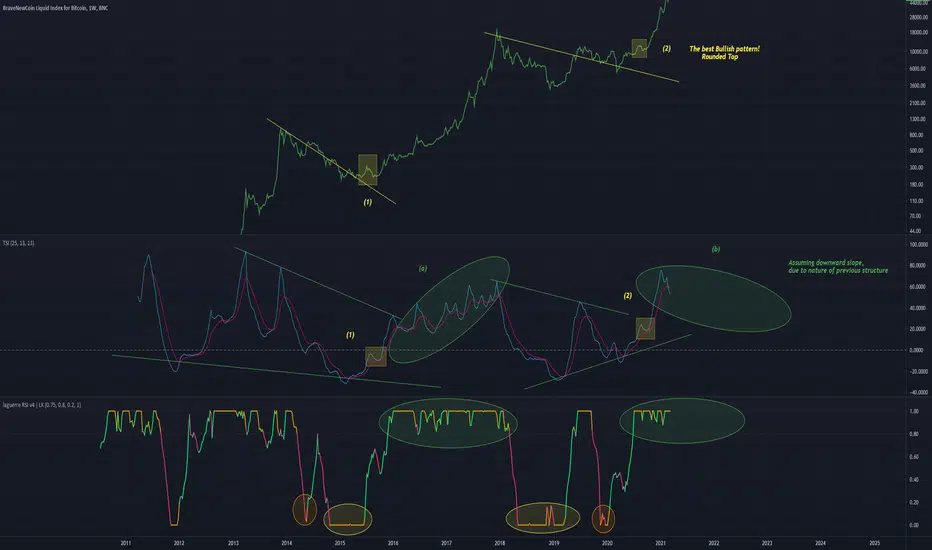
An idea using more indicators than usual
Patterns within TSI can be identified, assume that the 2017 parabola repeats (green circle on TSI)
Rounded top can be seen to produce consistent results throughout the history of BTC
My gut tells me that another 2017 parabolic wont occur again, and the different in structures on these indicators will account for that
I still believe Ethereum has a lot more potential for long term returns than BTC, and ill keep believing that until it eventuates.

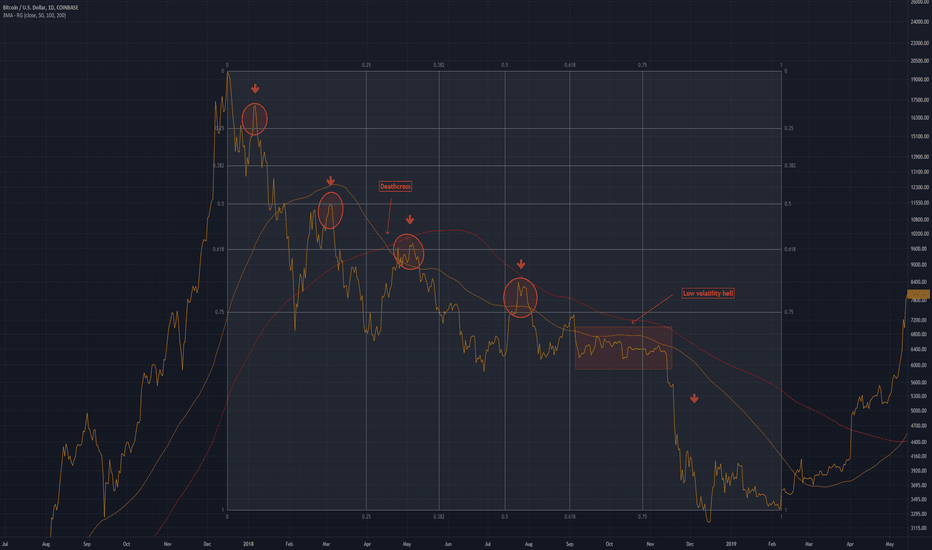
Above is an analysis of the 2018 Bear Market for BTC
Patterns within TSI can be identified, assume that the 2017 parabola repeats (green circle on TSI)
Rounded top can be seen to produce consistent results throughout the history of BTC
My gut tells me that another 2017 parabolic wont occur again, and the different in structures on these indicators will account for that
I still believe Ethereum has a lot more potential for long term returns than BTC, and ill keep believing that until it eventuates.
Above is an analysis of the 2018 Bear Market for BTC

免責事項
これらの情報および投稿は、TradingViewが提供または承認する金融、投資、取引、またはその他の種類の助言もしくは推奨であることを意図したものではなく、またこれらに該当するものでもありません。詳細は利用規約をご覧ください。
免責事項
これらの情報および投稿は、TradingViewが提供または承認する金融、投資、取引、またはその他の種類の助言もしくは推奨であることを意図したものではなく、またこれらに該当するものでもありません。詳細は利用規約をご覧ください。