
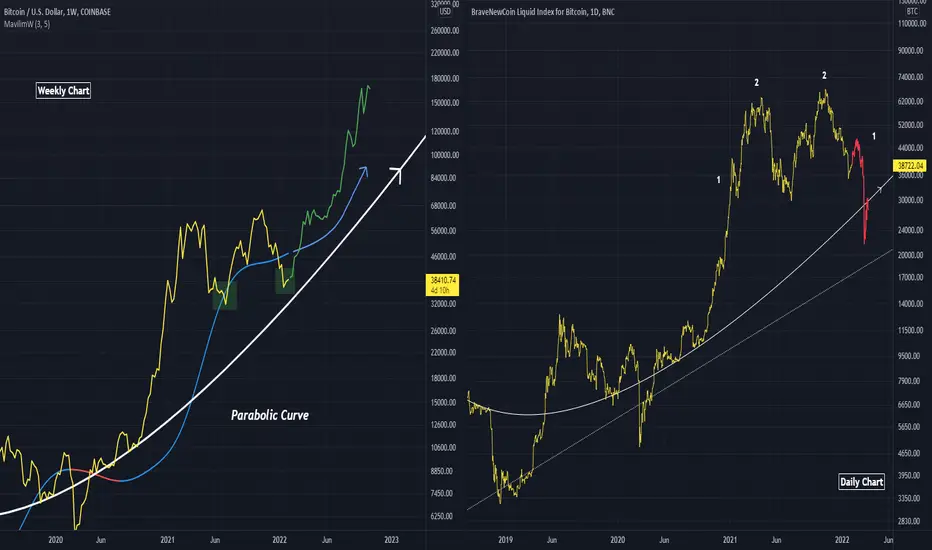
On the left I assume the Parabolic trend hodls, coupled with a double bottom , leading to price increase on the Weekly timeframe
On the right I assume a third breakdown under the same Parabolic trend occurs, as indicated by (1). This provides symmetry for the current formation and allows for the third dip.
Red pill, blue pill
On the right I assume a third breakdown under the same Parabolic trend occurs, as indicated by (1). This provides symmetry for the current formation and allows for the third dip.
Red pill, blue pill
ノート
The suggested peak (bars pattern) on the bull chart could just be the initial spike on the (1) move for the bears
免責事項
これらの情報および投稿は、TradingViewが提供または承認する金融、投資、取引、またはその他の種類の助言もしくは推奨であることを意図したものではなく、またこれらに該当するものでもありません。詳細は利用規約をご覧ください。
免責事項
これらの情報および投稿は、TradingViewが提供または承認する金融、投資、取引、またはその他の種類の助言もしくは推奨であることを意図したものではなく、またこれらに該当するものでもありません。詳細は利用規約をご覧ください。