
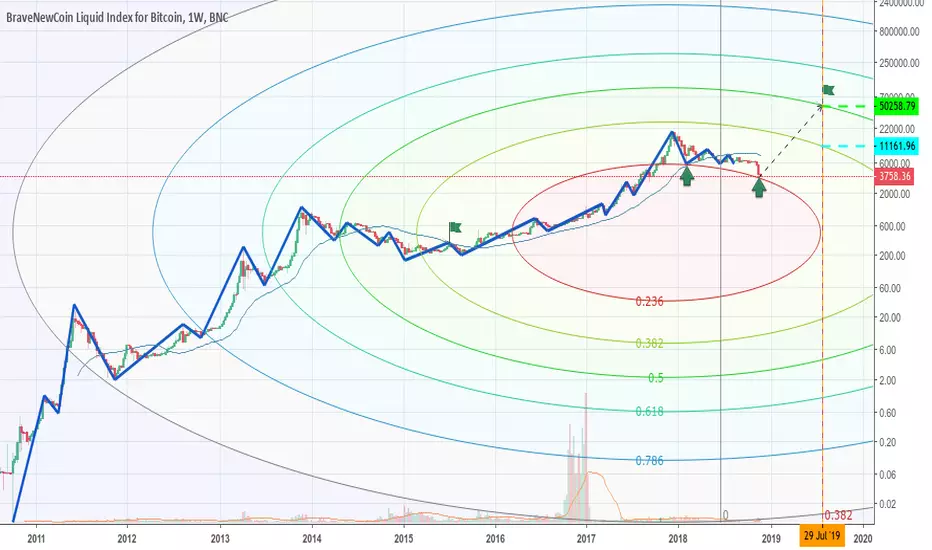
I saw people using this BNC to chart doom's day predictions and think about using it to do the inverse using a mix of circle fibs and extended time fibs. Extended time fibs is still a WIP on my toolbox, so I took the same ETF from the last crash and apply it to current crash in order to give me expected projection of when the next top market will happen and crossed it with my very accurate circle fib.
This is an optimist analysis with two possible outcomes, one very much on it's maximum and the other so so.
Btc is designed to get ripped and then explode on exponential swings so this view is based on repetition of this pattern.
If you liked my charts show some form of support so I continue posting.
ノート
Market is starting to leave the red 0.382 curve, soon to take off !ノート
As you can see the 0.382 circle fib is of great resistence right now
関連の投稿
免責事項
これらの情報および投稿は、TradingViewが提供または承認する金融、投資、取引、またはその他の種類の助言もしくは推奨であることを意図したものではなく、またこれらに該当するものでもありません。詳細は利用規約をご覧ください。
免責事項
これらの情報および投稿は、TradingViewが提供または承認する金融、投資、取引、またはその他の種類の助言もしくは推奨であることを意図したものではなく、またこれらに該当するものでもありません。詳細は利用規約をご覧ください。