
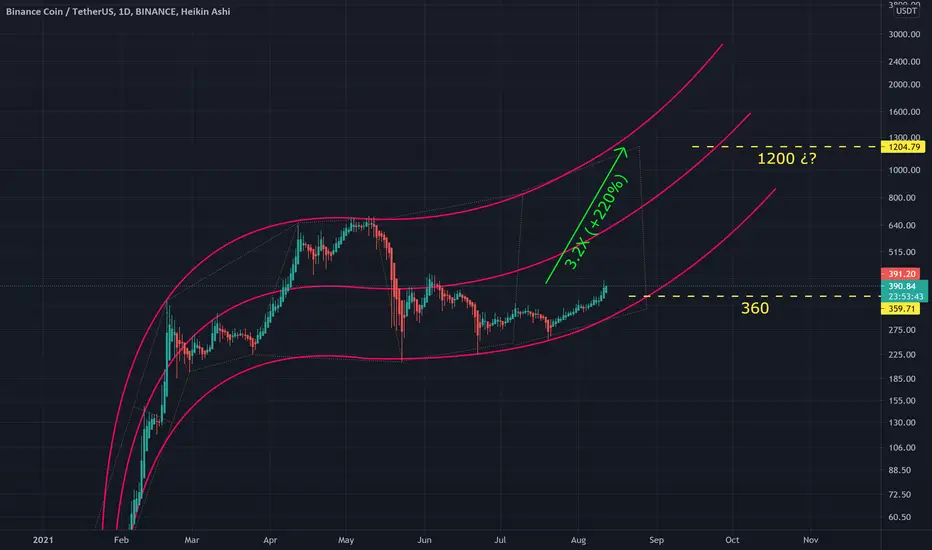
This is a curved projection channel created upon a bounding box. The chart is presented over a log price scale. For its creation we use 3 "moving averages" that cover the center, upper and lower boundaries for potential movement. Even if this not an attempt to forecast a trend or future scenario, it allows to have an easy to read view of probable limits and oscillation parameters.
You may find, in yellow dashed lines, an attempt to assert the lowest and highest price threshold.
Just sharing my personal charts for learning purposes only. This is not an investment recommendation.
You may find, in yellow dashed lines, an attempt to assert the lowest and highest price threshold.
Just sharing my personal charts for learning purposes only. This is not an investment recommendation.

免責事項
これらの情報および投稿は、TradingViewが提供または承認する金融、投資、取引、またはその他の種類の助言もしくは推奨であることを意図したものではなく、またこれらに該当するものでもありません。詳細は利用規約をご覧ください。
免責事項
これらの情報および投稿は、TradingViewが提供または承認する金融、投資、取引、またはその他の種類の助言もしくは推奨であることを意図したものではなく、またこれらに該当するものでもありません。詳細は利用規約をご覧ください。