
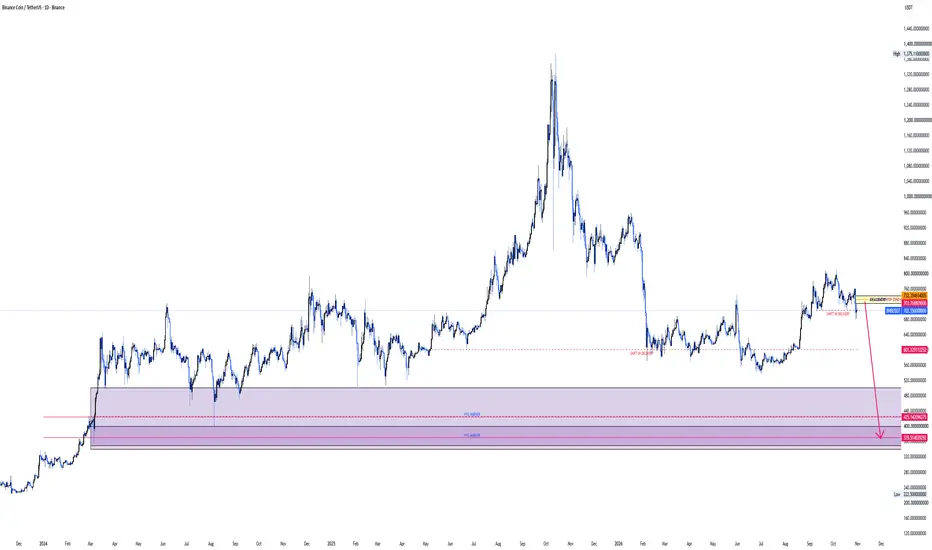
On the 12 month chart, price is yet to contact the imbalance at 425 indicating a possibility of a bearish price correction. On the 6 month chart, an additional imbalance is identified at 370 price handle.
On the monthly chart, we have a shift in market structure from bullish to bearish confirming possibility of price pushing lower to clear the market imbalance mentioned earlier. The daily chart further confirms a shift in market structure as price is expected to push lower. Our sell limit is placed at 732.4, our exit is either the medium term target at 425.15 or long term target at 370.51.
On the monthly chart, we have a shift in market structure from bullish to bearish confirming possibility of price pushing lower to clear the market imbalance mentioned earlier. The daily chart further confirms a shift in market structure as price is expected to push lower. Our sell limit is placed at 732.4, our exit is either the medium term target at 425.15 or long term target at 370.51.

Join my private groups [ Forex swing/position market calls] &[ Buy and Hold Crypto market calls]
afroswing.gumroad.com/
afroswing.gumroad.com/
関連の投稿
免責事項
これらの情報および投稿は、TradingViewが提供または承認する金融、投資、取引、またはその他の種類の助言もしくは推奨であることを意図したものではなく、またこれらに該当するものでもありません。詳細は利用規約をご覧ください。
Join my private groups [ Forex swing/position market calls] &[ Buy and Hold Crypto market calls]
afroswing.gumroad.com/
afroswing.gumroad.com/
関連の投稿
免責事項
これらの情報および投稿は、TradingViewが提供または承認する金融、投資、取引、またはその他の種類の助言もしくは推奨であることを意図したものではなく、またこれらに該当するものでもありません。詳細は利用規約をご覧ください。