
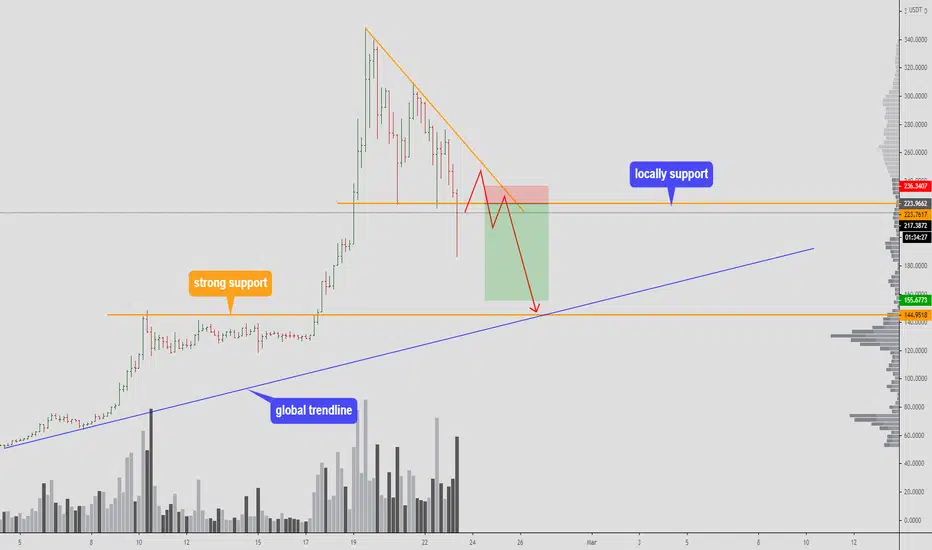
The descending triangle is recognized primarily in downtrends and is often thought of as a bearish signal. As you can see in the above image. The two lows on the above chart form the lower flat line of the triangle and, again, have to be only close in price action rather than exactly the same.
the fall is over!
Or is it a false fallout?
You will learn the best place where we can trade this instrument at low risk.
Write in the comments all your questions and instruments analysis of which you want to see.
Friends, push the like button, write a comment, and share with your mates - that would be the best THANK YOU.
P.S. I personally will open entry if the price will show it according to my strategy.
Always make your analysis before a trade
トレード稼働中

Join our copy service -
FREE trial
👇👇
bikotrading.short.gy/biko_copi
TG channel, Join to get all important updates and special BONUS $500 on your trading account
👇👇
t.me/+ICrmLIneDmRiYjIy
FREE trial
👇👇
bikotrading.short.gy/biko_copi
TG channel, Join to get all important updates and special BONUS $500 on your trading account
👇👇
t.me/+ICrmLIneDmRiYjIy
関連の投稿
免責事項
これらの情報および投稿は、TradingViewが提供または承認する金融、投資、取引、またはその他の種類の助言もしくは推奨であることを意図したものではなく、またこれらに該当するものでもありません。詳細は利用規約をご覧ください。