
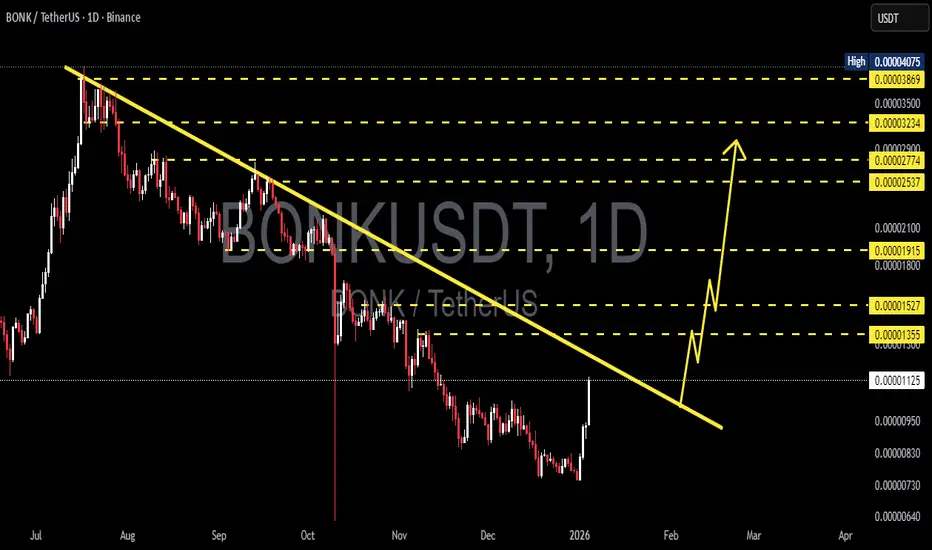
BONK/USDT is still trading within a clear primary downtrend structure that has been in place since the July–August 2025 peak. This is defined by a well-respected descending trendline (yellow line), which has acted as a dynamic resistance and rejected price multiple times.
Recently, in early January 2026, price showed a strong bullish reaction from the lower demand area, suggesting a potential relief rally or early-stage short-term reversal.
---
📐 Technical Structure & Patterns
🔻 Descending Trendline (Primary Bearish Structure)
Price remains below the descending trendline that has guided the downtrend for months.
Previous rallies failed at this trendline, confirming it as a strong dynamic resistance.
As long as price does not achieve a daily close above the trendline, the broader structure remains bearish.
🔄 Potential Bullish Reaction / Relief Rally
Strong bounce from the major support zone around 0.0000073 – 0.0000080.
Large bullish impulse candle indicates short covering or early accumulation.
Momentum is improving, but no confirmed breakout yet.
---
🟡 Key Support & Resistance Levels
Key Support:
0.00000830 – 0.00000730 → Major demand zone
Breakdown below this area could trigger further downside continuation.
Key Resistance Levels:
0.00001134 → nearest resistance
0.00001355
0.00001527
0.00001915 → critical resistance
Trendline zone + 0.00002100 – 0.00002537 → reversal confirmation area
---
🚀 Bullish Scenario
This scenario becomes valid if:
Price breaks and closes above the descending trendline on the daily timeframe
Supported by increasing volume
Bullish Targets (Step-by-Step):
1. 0.00001355
2. 0.00001527
3. 0.00001915
4. 0.00002537 – 0.00002774
📌 Interpretation:
A successful breakout above the trendline combined with a resistance reclaim would signal a trend shift from bearish continuation to bullish reversal.
---
⚠️ Bearish Scenario
This scenario remains valid if:
Price gets rejected from the descending trendline
Strong selling pressure appears around 0.00001134 – 0.00001355
Price breaks back below 0.00000830
Bearish Continuation Targets:
Retest of 0.00000730
Breakdown below this level could lead to new lower lows
📌 Interpretation:
The current bounce may only represent a dead cat bounce or corrective move within the larger downtrend.
---
🧠 Conclusion
BONK/USDT is currently at a critical decision zone.
The higher-timeframe structure remains bearish, but the recent bullish reaction opens the door for a short-term relief rally or early reversal attempt.
➡️ The key confirmation lies in a clean breakout above the descending trendline.
➡️ Until then, bias remains cautious (bearish to neutral).
---
#BONK #BONKUSDT #CryptoAnalysis #TechnicalAnalysis #Downtrend #Trendline #BullishReversal #BearishScenario #Altcoin #Memecoin #PriceAction #SupportResistance #CryptoTrading
Recently, in early January 2026, price showed a strong bullish reaction from the lower demand area, suggesting a potential relief rally or early-stage short-term reversal.
---
📐 Technical Structure & Patterns
🔻 Descending Trendline (Primary Bearish Structure)
Price remains below the descending trendline that has guided the downtrend for months.
Previous rallies failed at this trendline, confirming it as a strong dynamic resistance.
As long as price does not achieve a daily close above the trendline, the broader structure remains bearish.
🔄 Potential Bullish Reaction / Relief Rally
Strong bounce from the major support zone around 0.0000073 – 0.0000080.
Large bullish impulse candle indicates short covering or early accumulation.
Momentum is improving, but no confirmed breakout yet.
---
🟡 Key Support & Resistance Levels
Key Support:
0.00000830 – 0.00000730 → Major demand zone
Breakdown below this area could trigger further downside continuation.
Key Resistance Levels:
0.00001134 → nearest resistance
0.00001355
0.00001527
0.00001915 → critical resistance
Trendline zone + 0.00002100 – 0.00002537 → reversal confirmation area
---
🚀 Bullish Scenario
This scenario becomes valid if:
Price breaks and closes above the descending trendline on the daily timeframe
Supported by increasing volume
Bullish Targets (Step-by-Step):
1. 0.00001355
2. 0.00001527
3. 0.00001915
4. 0.00002537 – 0.00002774
📌 Interpretation:
A successful breakout above the trendline combined with a resistance reclaim would signal a trend shift from bearish continuation to bullish reversal.
---
⚠️ Bearish Scenario
This scenario remains valid if:
Price gets rejected from the descending trendline
Strong selling pressure appears around 0.00001134 – 0.00001355
Price breaks back below 0.00000830
Bearish Continuation Targets:
Retest of 0.00000730
Breakdown below this level could lead to new lower lows
📌 Interpretation:
The current bounce may only represent a dead cat bounce or corrective move within the larger downtrend.
---
🧠 Conclusion
BONK/USDT is currently at a critical decision zone.
The higher-timeframe structure remains bearish, but the recent bullish reaction opens the door for a short-term relief rally or early reversal attempt.
➡️ The key confirmation lies in a clean breakout above the descending trendline.
➡️ Until then, bias remains cautious (bearish to neutral).
---
#BONK #BONKUSDT #CryptoAnalysis #TechnicalAnalysis #Downtrend #Trendline #BullishReversal #BearishScenario #Altcoin #Memecoin #PriceAction #SupportResistance #CryptoTrading

✅ Get Free Signals! Join Our Telegram Channel Here: t.me/TheCryptoNuclear
✅ Twitter: twitter.com/crypto_nuclear
✅ Join Bybit : partner.bybit.com/b/nuclearvip
✅ Benefits : Lifetime Trading Fee Discount -50%
✅ Twitter: twitter.com/crypto_nuclear
✅ Join Bybit : partner.bybit.com/b/nuclearvip
✅ Benefits : Lifetime Trading Fee Discount -50%
免責事項
これらの情報および投稿は、TradingViewが提供または承認する金融、投資、取引、またはその他の種類の助言もしくは推奨であることを意図したものではなく、またこれらに該当するものでもありません。詳細は利用規約をご覧ください。
✅ Get Free Signals! Join Our Telegram Channel Here: t.me/TheCryptoNuclear
✅ Twitter: twitter.com/crypto_nuclear
✅ Join Bybit : partner.bybit.com/b/nuclearvip
✅ Benefits : Lifetime Trading Fee Discount -50%
✅ Twitter: twitter.com/crypto_nuclear
✅ Join Bybit : partner.bybit.com/b/nuclearvip
✅ Benefits : Lifetime Trading Fee Discount -50%
免責事項
これらの情報および投稿は、TradingViewが提供または承認する金融、投資、取引、またはその他の種類の助言もしくは推奨であることを意図したものではなく、またこれらに該当するものでもありません。詳細は利用規約をご覧ください。