BQXBTC has Dandruff
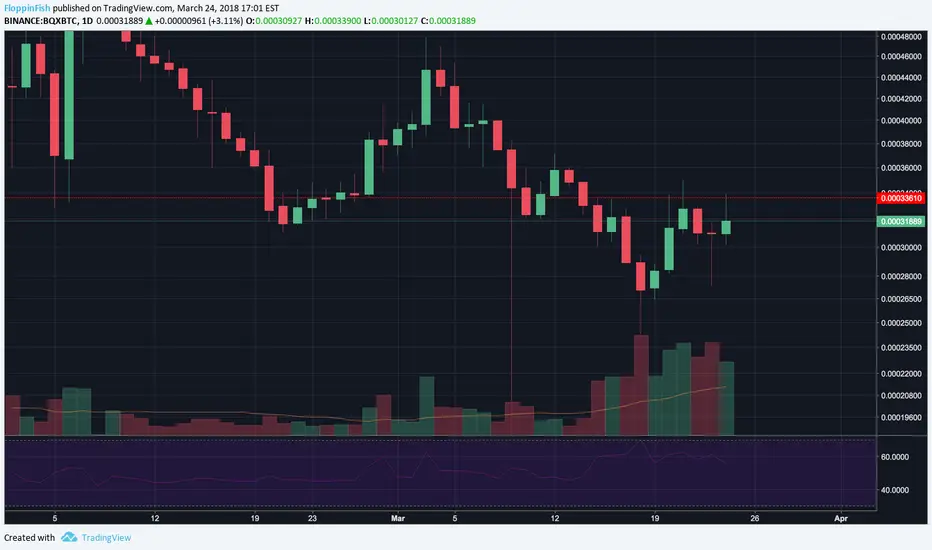
There seems to be a resistance or "dumb zone" @ 33600 SATS. Zoomed in closer to the 2H chart, BQX seems to have formed an inverted head and shoulders pattern. What I'm confused by though, is the volume. Shouldn't the volume indicate a valid H & S pattern? I see 4 bumps in volume, with the 3rd not correlating to a price action. Either way, it's going up or going down. I'll put in stop-losses.


免責事項
これらの情報および投稿は、TradingViewが提供または承認する金融、投資、取引、またはその他の種類の助言もしくは推奨であることを意図したものではなく、またこれらに該当するものでもありません。詳細は利用規約をご覧ください。
免責事項
これらの情報および投稿は、TradingViewが提供または承認する金融、投資、取引、またはその他の種類の助言もしくは推奨であることを意図したものではなく、またこれらに該当するものでもありません。詳細は利用規約をご覧ください。