
History never repeats but it tends to rime quite well.
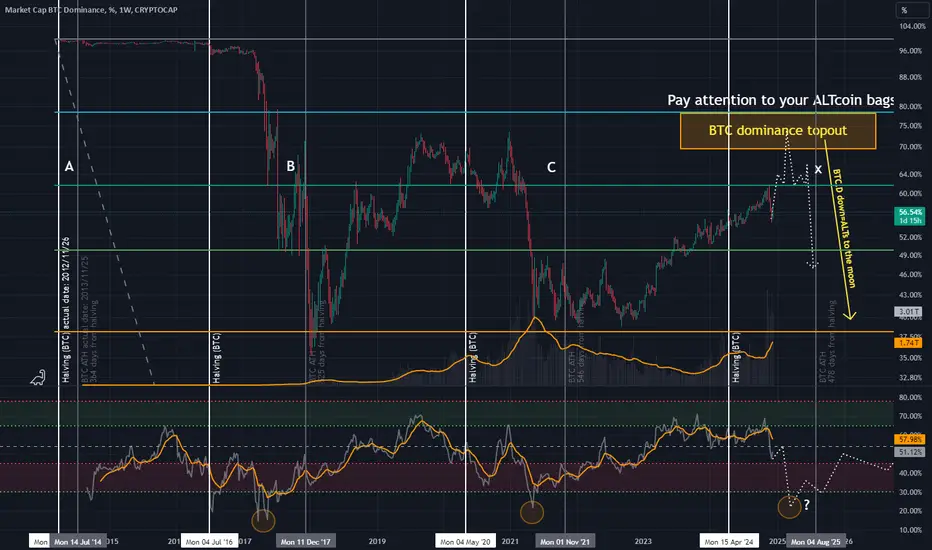
If we use that saying as the base for this thesis then we should see BTC.D top out at between 69-78% dominance using the horizontal resistance at the previous dominance top (2021).
To estimate this in a timely manner we plot the dates of the halvings and the date of BTC price ATH. To extrapolate the future cycle top we take the number of days from the halvings to the BTC price ATH and add them together and divide them by the number of cycle tops.
x=(a+b+c)/3
Historically we find confluence in the RSI momentum oscillator were the strength of the BTC.D is weakening hence gaining momentum to the downside. If history rimes we are entering that part of the cycle within the next 3-6 months.
If we use that saying as the base for this thesis then we should see BTC.D top out at between 69-78% dominance using the horizontal resistance at the previous dominance top (2021).
To estimate this in a timely manner we plot the dates of the halvings and the date of BTC price ATH. To extrapolate the future cycle top we take the number of days from the halvings to the BTC price ATH and add them together and divide them by the number of cycle tops.
x=(a+b+c)/3
Historically we find confluence in the RSI momentum oscillator were the strength of the BTC.D is weakening hence gaining momentum to the downside. If history rimes we are entering that part of the cycle within the next 3-6 months.

免責事項
これらの情報および投稿は、TradingViewが提供または承認する金融、投資、取引、またはその他の種類の助言もしくは推奨であることを意図したものではなく、またこれらに該当するものでもありません。詳細は利用規約をご覧ください。
免責事項
これらの情報および投稿は、TradingViewが提供または承認する金融、投資、取引、またはその他の種類の助言もしくは推奨であることを意図したものではなく、またこれらに該当するものでもありません。詳細は利用規約をご覧ください。