
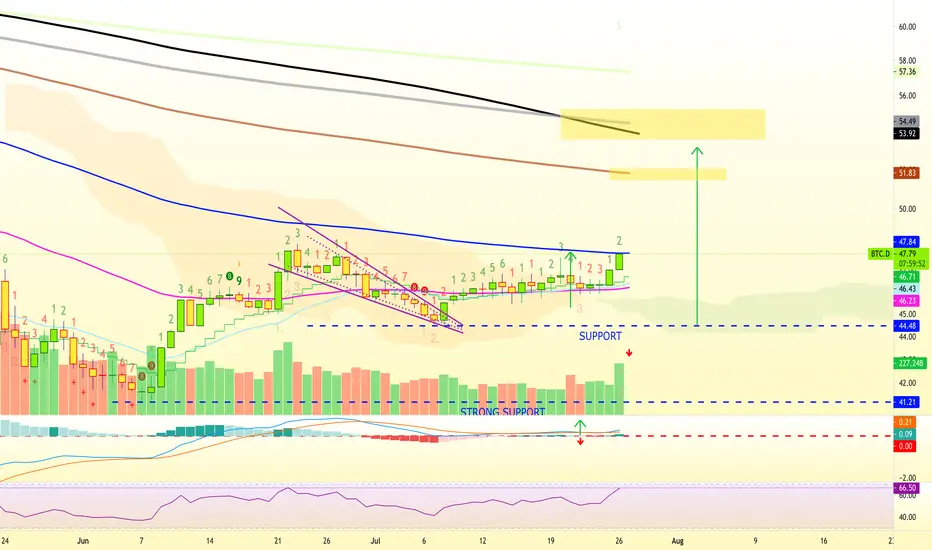
Recently I shared a chart for Bitcoin Dominance (BTC.D).
Here is a follow up, short and simple...
I believe this chart will continue climbing until reaching 50 and higher.
The indicators, RSI and MACD, as well as the volume bars and the candles (candlestick reading) support this.
Previous chart: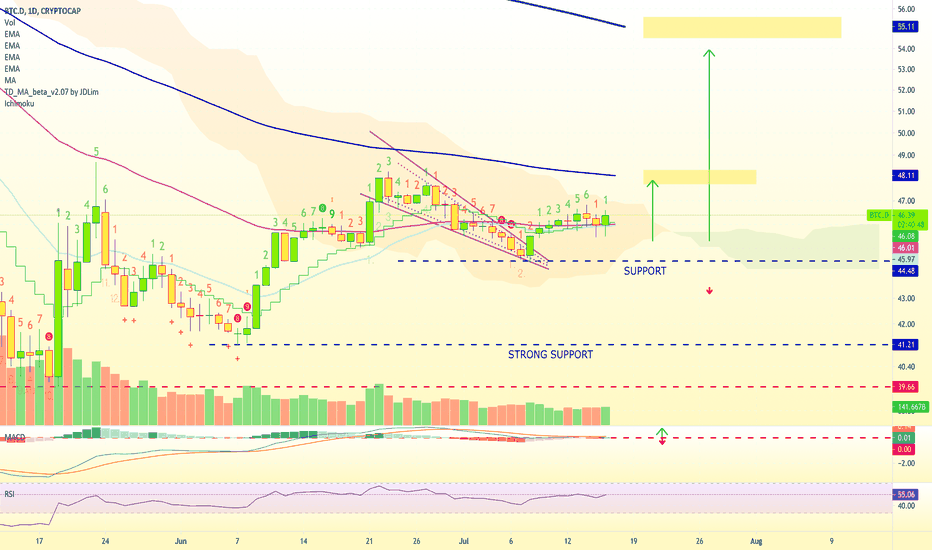
Remember to hit LIKE and leave a comment.
Namaste.
Here is a follow up, short and simple...
I believe this chart will continue climbing until reaching 50 and higher.
The indicators, RSI and MACD, as well as the volume bars and the candles (candlestick reading) support this.
Previous chart:
Remember to hit LIKE and leave a comment.
Namaste.
ノート
BTC.D closed daily to the upside above EMA100.It is the first time this happens since October 2020.
This is a strong bullish signal, specially if it can stay above this level.
EMA100 here is represented by the blue line on the chart.

💯 Trading signals (results)
— Late 2026👇
t.me/masteranandatrades/9279
🔥 10-25X Leverage
—Trade-numbers:
t.me/masteranandatrades/9271
✅ PREMIUM &Content
—One-Time Payment
t.me/lamatrades/4 (🔝 since 2017)
— Late 2026👇
t.me/masteranandatrades/9279
🔥 10-25X Leverage
—Trade-numbers:
t.me/masteranandatrades/9271
✅ PREMIUM &Content
—One-Time Payment
t.me/lamatrades/4 (🔝 since 2017)
関連の投稿
免責事項
これらの情報および投稿は、TradingViewが提供または承認する金融、投資、取引、またはその他の種類の助言もしくは推奨であることを意図したものではなく、またこれらに該当するものでもありません。詳細は利用規約をご覧ください。
💯 Trading signals (results)
— Late 2026👇
t.me/masteranandatrades/9279
🔥 10-25X Leverage
—Trade-numbers:
t.me/masteranandatrades/9271
✅ PREMIUM &Content
—One-Time Payment
t.me/lamatrades/4 (🔝 since 2017)
— Late 2026👇
t.me/masteranandatrades/9279
🔥 10-25X Leverage
—Trade-numbers:
t.me/masteranandatrades/9271
✅ PREMIUM &Content
—One-Time Payment
t.me/lamatrades/4 (🔝 since 2017)
関連の投稿
免責事項
これらの情報および投稿は、TradingViewが提供または承認する金融、投資、取引、またはその他の種類の助言もしくは推奨であることを意図したものではなく、またこれらに該当するものでもありません。詳細は利用規約をご覧ください。