
Hello Team,
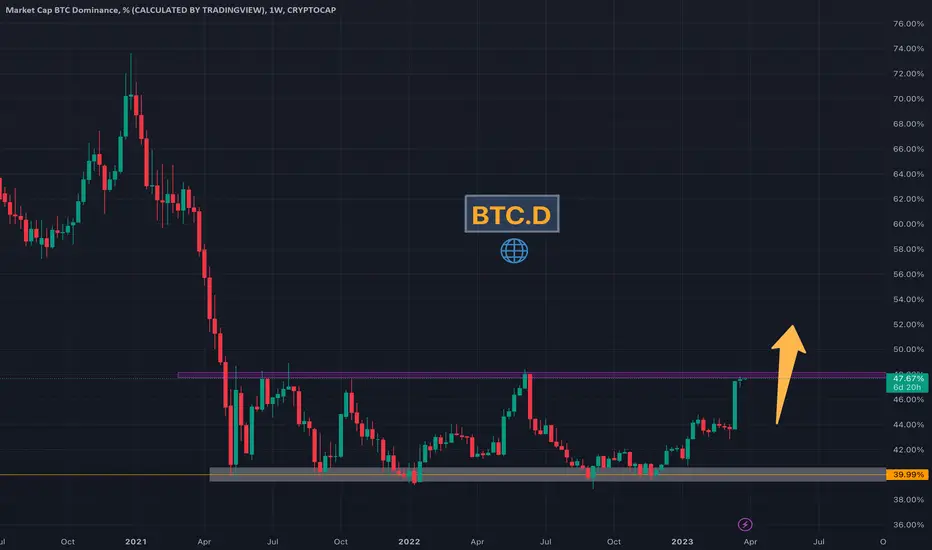
This chart views the Bitcoin Dominance, it calculates Bitcoin's current share of the global cryptocurrency market cap.
As you can see the Bitcoin Dominance chart is at resistance from a weekly consolidation zone.
If we break this resistance level we can see a continuation in the Bitcoin price towards 30K and beyond while most of the money flows from Alts into BTC.
During a typical bull cycle money will flow into Bitcoin while most of the alt-coins do not have much action. Then when Bitcoin starts to come back down money will flow from Bitcoin back into the Alt-coins.
Keep your eyes on this significant level. A break from this consolidation will provide us more insight on the movement of the cryptocurrency market.
Enjoy!
This chart views the Bitcoin Dominance, it calculates Bitcoin's current share of the global cryptocurrency market cap.
As you can see the Bitcoin Dominance chart is at resistance from a weekly consolidation zone.
If we break this resistance level we can see a continuation in the Bitcoin price towards 30K and beyond while most of the money flows from Alts into BTC.
During a typical bull cycle money will flow into Bitcoin while most of the alt-coins do not have much action. Then when Bitcoin starts to come back down money will flow from Bitcoin back into the Alt-coins.
Keep your eyes on this significant level. A break from this consolidation will provide us more insight on the movement of the cryptocurrency market.
Enjoy!

免責事項
これらの情報および投稿は、TradingViewが提供または承認する金融、投資、取引、またはその他の種類の助言もしくは推奨であることを意図したものではなく、またこれらに該当するものでもありません。詳細は利用規約をご覧ください。
免責事項
これらの情報および投稿は、TradingViewが提供または承認する金融、投資、取引、またはその他の種類の助言もしくは推奨であることを意図したものではなく、またこれらに該当するものでもありません。詳細は利用規約をご覧ください。