
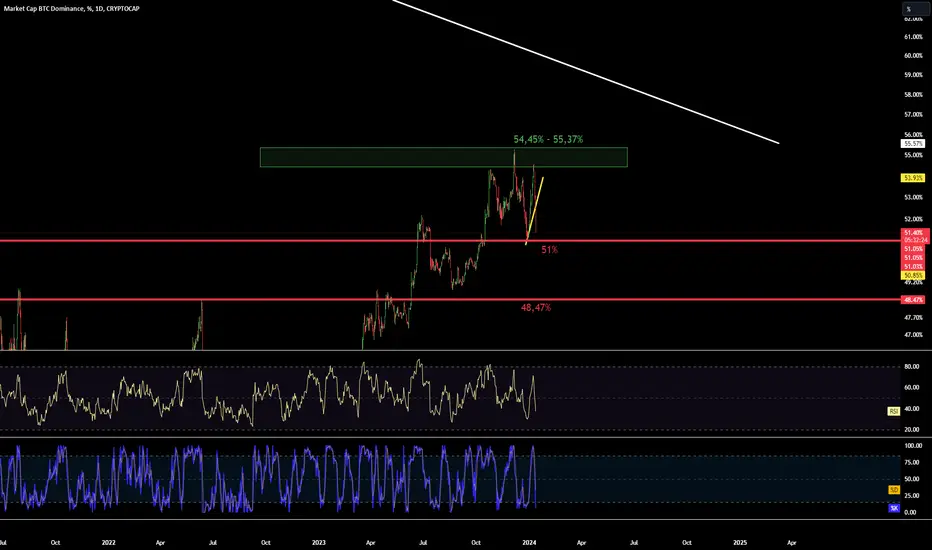
Hello everyone, I invite you to every Friday's review of the leading cryptocurrencies, let's start by checking the situation regarding BTC's dominance over the rest of the market. We will start by defining, using the yellow line, a local upward trend that was dynamically interrupted by a sudden capital flow.
Moving forward, we will unfold the Fib Retracement mesh to check potential support locations. And here we can see that even the level of 0.618 golden FIB point was quickly broken, and currently the closest support is at 51%. However, if this support is broken, we may observe further capital flow and, consequently, a return to the area of the next important support at the level of 48.47%.
When we unfold the fib retracement in the second direction, we can mark the main resistance zone from 54.45% to 55.37%, which effectively stops the inflow of capital into BTC.
We can also switch to a one-day time frame, and after zooming out the chart, we can determine the main downward trend line using the white line.
Moving forward, we will unfold the Fib Retracement mesh to check potential support locations. And here we can see that even the level of 0.618 golden FIB point was quickly broken, and currently the closest support is at 51%. However, if this support is broken, we may observe further capital flow and, consequently, a return to the area of the next important support at the level of 48.47%.
When we unfold the fib retracement in the second direction, we can mark the main resistance zone from 54.45% to 55.37%, which effectively stops the inflow of capital into BTC.
We can also switch to a one-day time frame, and after zooming out the chart, we can determine the main downward trend line using the white line.

免責事項
これらの情報および投稿は、TradingViewが提供または承認する金融、投資、取引、またはその他の種類の助言もしくは推奨であることを意図したものではなく、またこれらに該当するものでもありません。詳細は利用規約をご覧ください。
免責事項
これらの情報および投稿は、TradingViewが提供または承認する金融、投資、取引、またはその他の種類の助言もしくは推奨であることを意図したものではなく、またこれらに該当するものでもありません。詳細は利用規約をご覧ください。