
Hello, community members welcome you all to this market cap BTC.D 1D chart analysis.
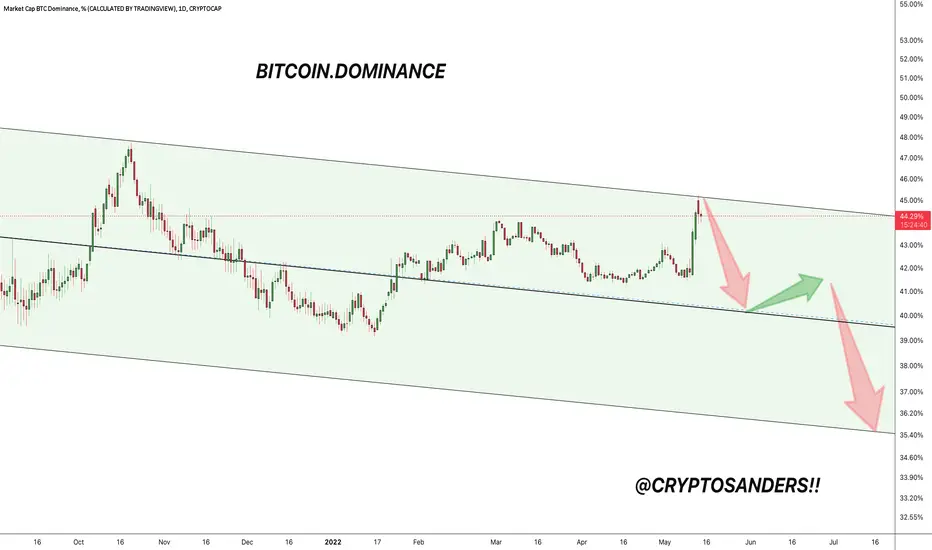
As we can see from the above-mentioned chart that BTC.D war trading inside the parallel Chanel pattern.
Currently, BTC.D faces the upper trend line which is also a resistance level that BTC.D following for the last 355days.
Now here I am expecting a rejection from the resistance level and it will dump towards the middle trend line.
Which will be the green signal for BTC in the upcoming days
This is not a piece of financial advice.
Sorry for my English it is not my native language.
If you like it, hit the like button and share your charts in the comments section.
thank you..
As we can see from the above-mentioned chart that BTC.D war trading inside the parallel Chanel pattern.
Currently, BTC.D faces the upper trend line which is also a resistance level that BTC.D following for the last 355days.
Now here I am expecting a rejection from the resistance level and it will dump towards the middle trend line.
Which will be the green signal for BTC in the upcoming days
This is not a piece of financial advice.
Sorry for my English it is not my native language.
If you like it, hit the like button and share your charts in the comments section.
thank you..

関連の投稿
免責事項
これらの情報および投稿は、TradingViewが提供または承認する金融、投資、取引、またはその他の種類の助言もしくは推奨であることを意図したものではなく、またこれらに該当するものでもありません。詳細は利用規約をご覧ください。
関連の投稿
免責事項
これらの情報および投稿は、TradingViewが提供または承認する金融、投資、取引、またはその他の種類の助言もしくは推奨であることを意図したものではなく、またこれらに該当するものでもありません。詳細は利用規約をご覧ください。