
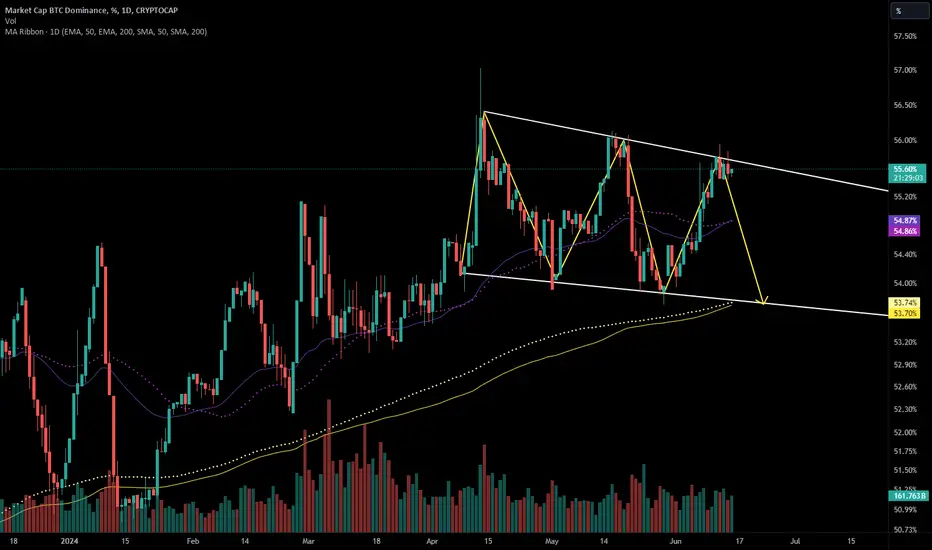
Might be a drop here down towards the 200 day EMA/MA and the bottom of this bull flag or falling wedge on the daily.
This could provide some reliefs to #alts vs. BTC while Bitcoin corrects down to 60-63k area
Short-term short until 53-54% area, then long again, may range within the wedge for a while, too.
This could provide some reliefs to #alts vs. BTC while Bitcoin corrects down to 60-63k area
Short-term short until 53-54% area, then long again, may range within the wedge for a while, too.
注文をキャンセル
Initially moved down from wedge top but has since broken above, invalidating this idea and now targeting 58-59%トレード稼働中
I'm actually re-opening this, the breakout is looking weak as wedge top is being re-tested on the daily. Let's see if it holds and invalidates this idea or if it ends up moving back inside the wedge and down again:トレード稼働中
Moved back inside the wedge, back on track with the original idea after a failed breakout above:
免責事項
これらの情報および投稿は、TradingViewが提供または承認する金融、投資、取引、またはその他の種類の助言もしくは推奨であることを意図したものではなく、またこれらに該当するものでもありません。詳細は利用規約をご覧ください。
免責事項
これらの情報および投稿は、TradingViewが提供または承認する金融、投資、取引、またはその他の種類の助言もしくは推奨であることを意図したものではなく、またこれらに該当するものでもありません。詳細は利用規約をご覧ください。