
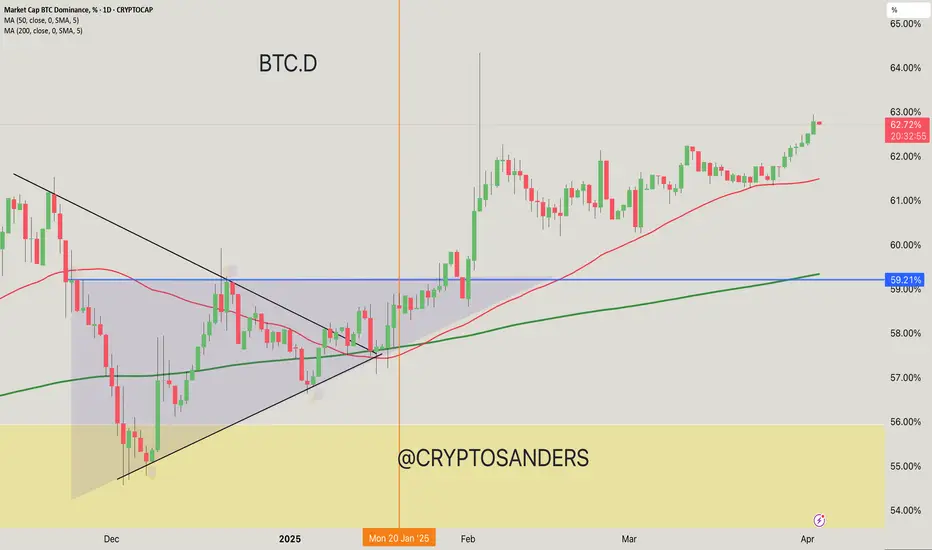
50-day MA: 61.94% (Notable Support Level)
200-day MA: 59.21% (Strong Support)
Trend: The chart shows a bullish trend in BTC dominance since the beginning of the year, with higher lows forming.
Resistance Level: A key resistance area lies around 63%, which the price is currently testing.
Support Level: The 50-day and 200-day moving averages provide solid support below current levels.
Update Points
Short-term outlook: If BTC dominance stays above 62%, it could reach 63% resistance.
Long-term indicators: Continued support at the moving averages suggests bullish sentiment if BTC can maintain its position.
Market Conditions: Monitor fluctuations in altcoin performance, which could impact BTC's dominance positively or negatively.
If you found this analysis helpful, hit the Like button and share your thoughts or questions in the comments below. Your feedback matters!
Thanks for your support!
DYOR. NFA
200-day MA: 59.21% (Strong Support)
Trend: The chart shows a bullish trend in BTC dominance since the beginning of the year, with higher lows forming.
Resistance Level: A key resistance area lies around 63%, which the price is currently testing.
Support Level: The 50-day and 200-day moving averages provide solid support below current levels.
Update Points
Short-term outlook: If BTC dominance stays above 62%, it could reach 63% resistance.
Long-term indicators: Continued support at the moving averages suggests bullish sentiment if BTC can maintain its position.
Market Conditions: Monitor fluctuations in altcoin performance, which could impact BTC's dominance positively or negatively.
If you found this analysis helpful, hit the Like button and share your thoughts or questions in the comments below. Your feedback matters!
Thanks for your support!
DYOR. NFA

関連の投稿
免責事項
これらの情報および投稿は、TradingViewが提供または承認する金融、投資、取引、またはその他の種類の助言もしくは推奨であることを意図したものではなく、またこれらに該当するものでもありません。詳細は利用規約をご覧ください。
関連の投稿
免責事項
これらの情報および投稿は、TradingViewが提供または承認する金融、投資、取引、またはその他の種類の助言もしくは推奨であることを意図したものではなく、またこれらに該当するものでもありません。詳細は利用規約をご覧ください。