
Hello guys!
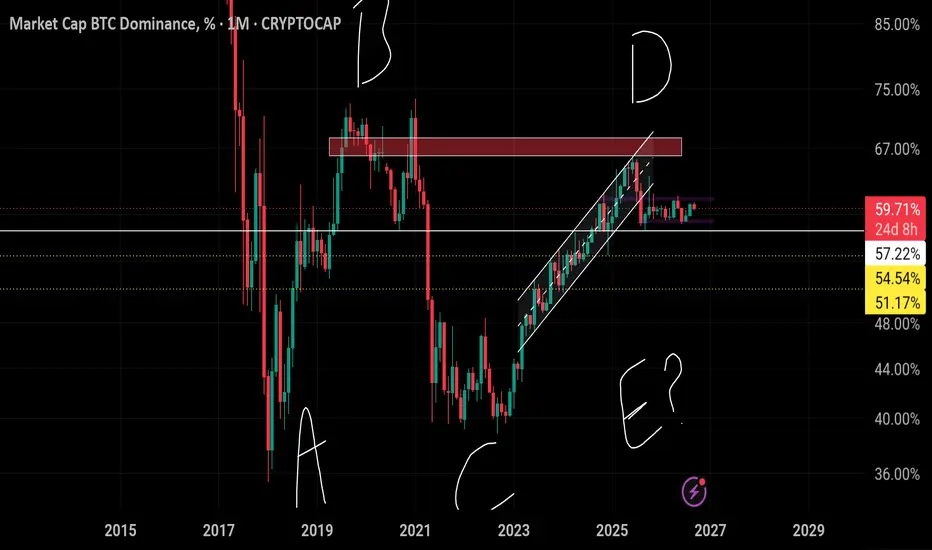
We're looking at Bitcoin dominance on the monthly chart. It's been ranging for several months now, which is exactly why altcoins have been moving in sync with Bitcoin's fluctuations, without showing their own strength.
Based on Elliott Wave counts and the break below the channel support after hitting a supply zone, a monthly close below the 57.2% level would turn the trend bearish for this index. It could potentially drop as low as 52–54%.
The key is the combination: if dominance falls and at the same time BTC holds steady or goes up, that's when altcoins will likely pump hard.
NFA-DYOR
Dont forget to follow!
JavanshirAcademy
retrader

Financial Service - Educational Academy - Investment Platform - Option Trading _ Option Strategist ...
免責事項
これらの情報および投稿は、TradingViewが提供または承認する金融、投資、取引、またはその他の種類の助言もしくは推奨であることを意図したものではなく、またこれらに該当するものでもありません。詳細は利用規約をご覧ください。
Financial Service - Educational Academy - Investment Platform - Option Trading _ Option Strategist ...
免責事項
これらの情報および投稿は、TradingViewが提供または承認する金融、投資、取引、またはその他の種類の助言もしくは推奨であることを意図したものではなく、またこれらに該当するものでもありません。詳細は利用規約をご覧ください。