
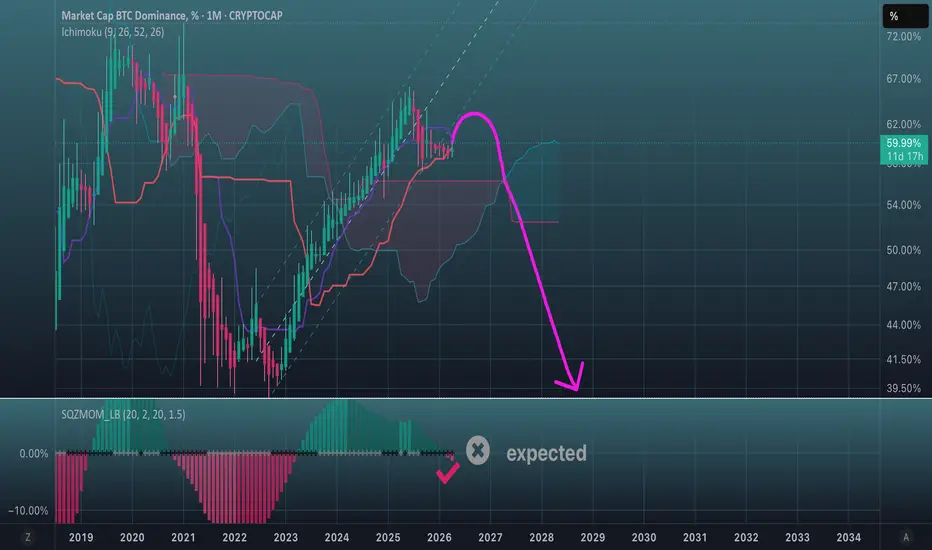
Every trader believes that they understand the pattern correctly. I won't argue that I'm better at it than others, but I'm wary of drawing giant triangles and megaphones that date back to 2016. Let's focus on the channel. We're dealing with a channel. The channel has been breached, but it hasn't led to a rapid decline. What might be missing? There's a lack of evidence that the dominance can't jump back into the channel. We need a retest of the channel's bottom from the opposite side. Based on my experience, we won't end with just one candle. BTC.D will approach the channel from the opposite side and "creep" along it with a series of candles. Eventually, it's likely to collapse. However, we should focus on the 1M chart, as the peak events for the altseason may be postponed for another year. In April 2027, the red cloud will transition into the green cloud, and the area where the clouds change is often the area of breakout. I've seen this many times. However, the Dominance may start moving in that direction this year.
ノート
トレード稼働中

免責事項
これらの情報および投稿は、TradingViewが提供または承認する金融、投資、取引、またはその他の種類の助言もしくは推奨であることを意図したものではなく、またこれらに該当するものでもありません。詳細は利用規約をご覧ください。
免責事項
これらの情報および投稿は、TradingViewが提供または承認する金融、投資、取引、またはその他の種類の助言もしくは推奨であることを意図したものではなく、またこれらに該当するものでもありません。詳細は利用規約をご覧ください。