
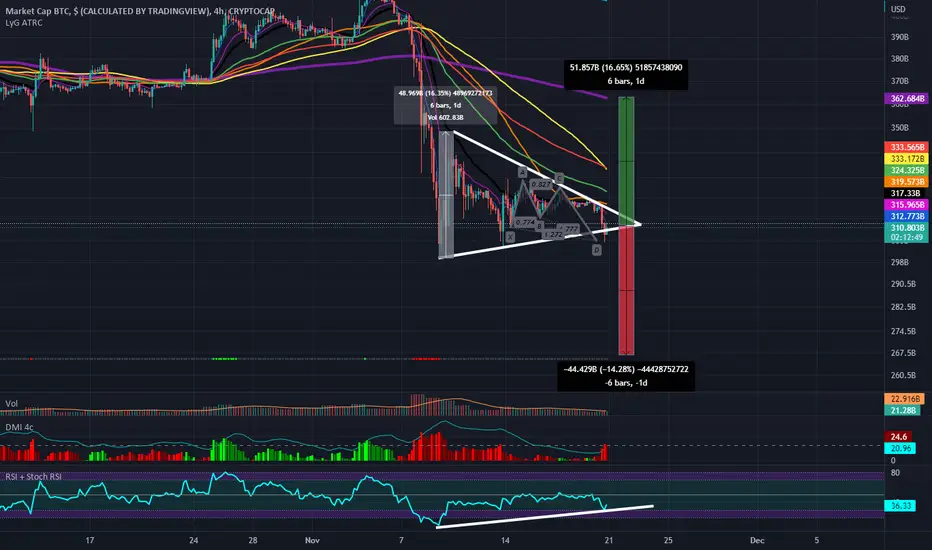
BTC is trading within this Symetrical Triangle which is a pattern that happens to be Neutral but it's showing a slightly Bullish Edge in the form of the 4 Hour Bullish Butterfly anbd the 4 Hour RSI Bullish Divergence perhaps from where we are now we could atleast see some sorta action back above the top side of this consolidation structure.

関連の投稿
免責事項
これらの情報および投稿は、TradingViewが提供または承認する金融、投資、取引、またはその他の種類の助言もしくは推奨であることを意図したものではなく、またこれらに該当するものでもありません。詳細は利用規約をご覧ください。
免責事項
これらの情報および投稿は、TradingViewが提供または承認する金融、投資、取引、またはその他の種類の助言もしくは推奨であることを意図したものではなく、またこれらに該当するものでもありません。詳細は利用規約をご覧ください。