
Macro Structure and Setup:
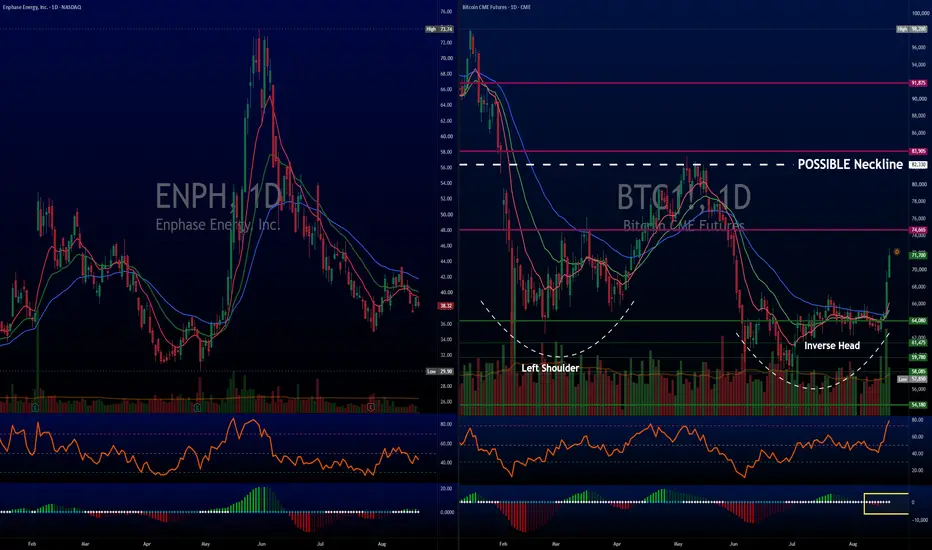
Bitcoin CME Futures are making a decisive technical move on the daily timeframe. Looking at the primary chart on the left, price is staging a clean breakout above the multi month white descending trendline that has capped price action since the early yearly highs.
Concurrently, the dual view on the right outlines a textbook inverse head and shoulders bottoming structure being FORMED.
Momentum and Indicators:
Relative Strength Index: The RSI is tracking in healthy bullish expansion. It has cleared the neutral 50 line with authority and is showing strong upward slope without hitting immediate blow off exhaustion levels.
TTM Squeeze Momentum: The TTM histogram is printing clear positive divergence against the prior lows. While the indicator still needs a little more time to fully dictate the broader macro continuation, the contracting red momentum and shift toward buying pressure strongly favor bulls.
Volume Profile: Daily volume expansion is validating this trendline breach. We are seeing sustained participation rather than a low liquidity fakeout.
Key Technical Levels:
First Major Test (74.6k to 75k): This horizontal shelf is the immediate hurdle. A daily close above 75k confirms continuation and traps lingering shorts.
Primary Target / Possible Neckline (82k): Clearing 75k opens a direct runway into the 82k+ area. This marks the major structural neckline where the move will likely face its heaviest supply test before momentum cools down.
Trading Takeaway
Watch for daily closes to hold above the broken white trendline. As long as price remains supported above the breakout zone, momentum favors a test of 75k followed by an extension into the 82k neckline.
Bitcoin CME Futures are making a decisive technical move on the daily timeframe. Looking at the primary chart on the left, price is staging a clean breakout above the multi month white descending trendline that has capped price action since the early yearly highs.
Concurrently, the dual view on the right outlines a textbook inverse head and shoulders bottoming structure being FORMED.
Momentum and Indicators:
Relative Strength Index: The RSI is tracking in healthy bullish expansion. It has cleared the neutral 50 line with authority and is showing strong upward slope without hitting immediate blow off exhaustion levels.
TTM Squeeze Momentum: The TTM histogram is printing clear positive divergence against the prior lows. While the indicator still needs a little more time to fully dictate the broader macro continuation, the contracting red momentum and shift toward buying pressure strongly favor bulls.
Volume Profile: Daily volume expansion is validating this trendline breach. We are seeing sustained participation rather than a low liquidity fakeout.
Key Technical Levels:
First Major Test (74.6k to 75k): This horizontal shelf is the immediate hurdle. A daily close above 75k confirms continuation and traps lingering shorts.
Primary Target / Possible Neckline (82k): Clearing 75k opens a direct runway into the 82k+ area. This marks the major structural neckline where the move will likely face its heaviest supply test before momentum cools down.
Trading Takeaway
Watch for daily closes to hold above the broken white trendline. As long as price remains supported above the breakout zone, momentum favors a test of 75k followed by an extension into the 82k neckline.


関連の投稿
免責事項
これらの情報および投稿は、TradingViewが提供または承認する金融、投資、取引、またはその他の種類の助言もしくは推奨であることを意図したものではなく、またこれらに該当するものでもありません。詳細は利用規約をご覧ください。
関連の投稿
免責事項
これらの情報および投稿は、TradingViewが提供または承認する金融、投資、取引、またはその他の種類の助言もしくは推奨であることを意図したものではなく、またこれらに該当するものでもありません。詳細は利用規約をご覧ください。