
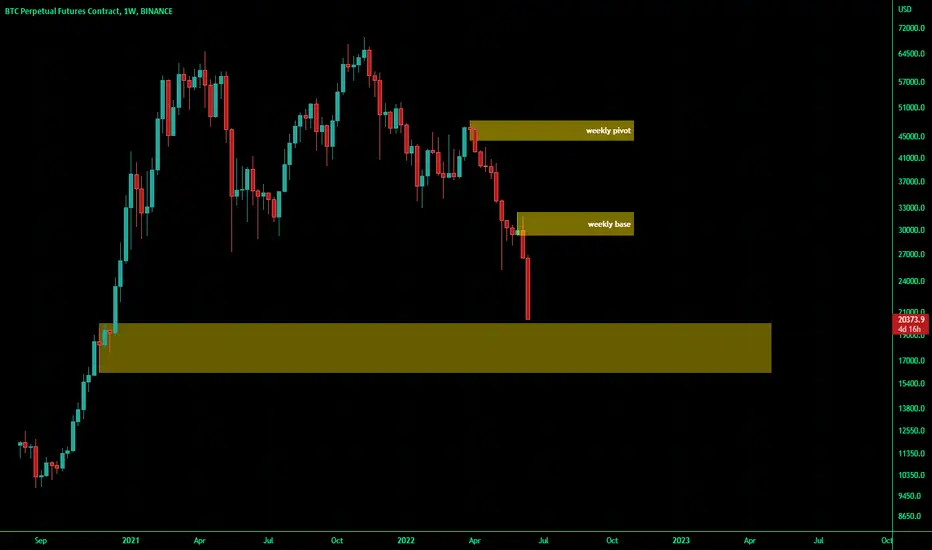
from supply and demand analysis point of view,
the areas that can clearly be seen on the chart are these yellow rectangles the analysis is like having the price stop running down on the lowest area and start an upward to the first green candle and the price will be in a trading range for while (1 year or 2 maybe )
the areas that can clearly be seen on the chart are these yellow rectangles the analysis is like having the price stop running down on the lowest area and start an upward to the first green candle and the price will be in a trading range for while (1 year or 2 maybe )

免責事項
これらの情報および投稿は、TradingViewが提供または承認する金融、投資、取引、またはその他の種類の助言もしくは推奨であることを意図したものではなく、またこれらに該当するものでもありません。詳細は利用規約をご覧ください。
免責事項
これらの情報および投稿は、TradingViewが提供または承認する金融、投資、取引、またはその他の種類の助言もしくは推奨であることを意図したものではなく、またこれらに該当するものでもありません。詳細は利用規約をご覧ください。