
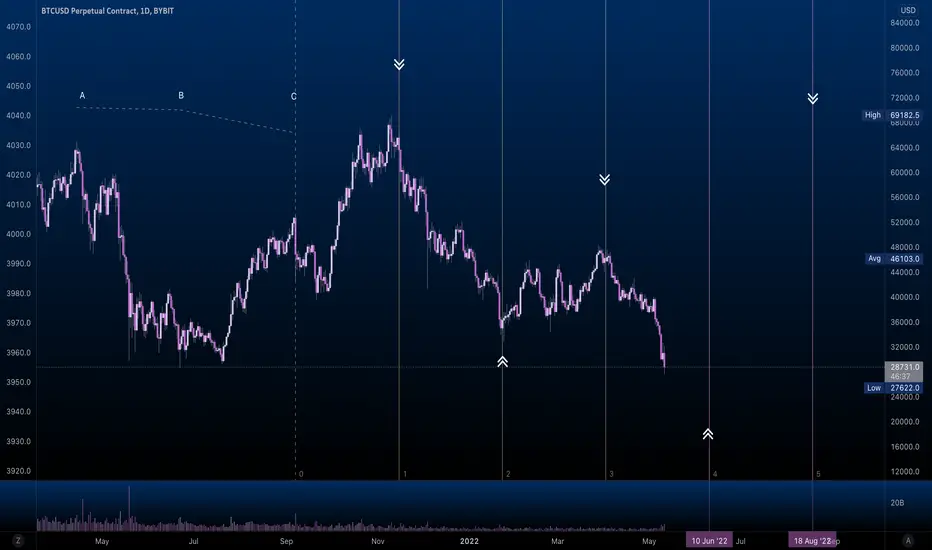
Take the April high, June low and extend from Sept high. Use 1:1 time ratios of A->B. Pretty much times every major pivot. To take this further and get a more accurate answer, use older pivots on another chart perhaps. I noticed that using negative 1:1 values also showed confluence, however it's slightly off.

免責事項
これらの情報および投稿は、TradingViewが提供または承認する金融、投資、取引、またはその他の種類の助言もしくは推奨であることを意図したものではなく、またこれらに該当するものでもありません。詳細は利用規約をご覧ください。
免責事項
これらの情報および投稿は、TradingViewが提供または承認する金融、投資、取引、またはその他の種類の助言もしくは推奨であることを意図したものではなく、またこれらに該当するものでもありません。詳細は利用規約をご覧ください。