
Based on the 3D chart:

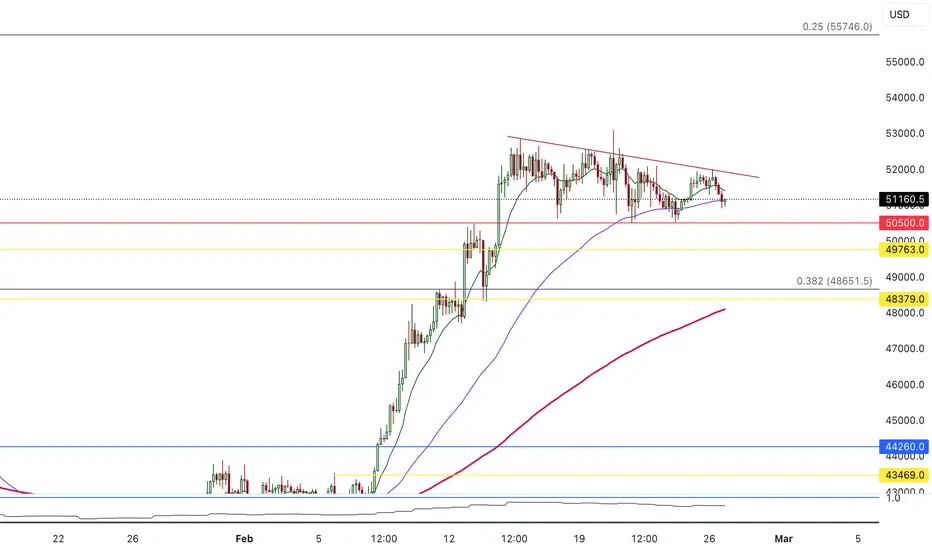
BTC broke through the major resistance range of 48379.0~49763.0, reaching a high of 53094.5. BTC still has the potential to test 55746.0, but before that, a price correction may be needed.
-
In terms of the four-hour chart shown above, although BTC has received support near 50500.0 multiple times, the rebound momentum is not strong, and the price has not been pushed further higher, instead showing lower highs. Pay attention to whether BTC falls below 50500.0 and the support range below 48379.0~49763.0. If BTC's price remains above this major support range(48379.0~49763.0), the chance of rising to 55746.0 is still relatively high. However, if it falls below this range(48379.0~49763.0), a larger price correction is expected.
-
BTC broke through the major resistance range of 48379.0~49763.0, reaching a high of 53094.5. BTC still has the potential to test 55746.0, but before that, a price correction may be needed.
-
In terms of the four-hour chart shown above, although BTC has received support near 50500.0 multiple times, the rebound momentum is not strong, and the price has not been pushed further higher, instead showing lower highs. Pay attention to whether BTC falls below 50500.0 and the support range below 48379.0~49763.0. If BTC's price remains above this major support range(48379.0~49763.0), the chance of rising to 55746.0 is still relatively high. However, if it falls below this range(48379.0~49763.0), a larger price correction is expected.
-

bybit sign up:
partner.bybit.com/b/56404
partner.bybit.com/b/56404
関連の投稿
免責事項
これらの情報および投稿は、TradingViewが提供または承認する金融、投資、取引、またはその他の種類の助言もしくは推奨であることを意図したものではなく、またこれらに該当するものでもありません。詳細は利用規約をご覧ください。
bybit sign up:
partner.bybit.com/b/56404
partner.bybit.com/b/56404
関連の投稿
免責事項
これらの情報および投稿は、TradingViewが提供または承認する金融、投資、取引、またはその他の種類の助言もしくは推奨であることを意図したものではなく、またこれらに該当するものでもありません。詳細は利用規約をご覧ください。