
Hello
It's a Bitcoin Guide.
My analysis is optimized for TradingView.
If you press the Replay button, you can check real-time movements.

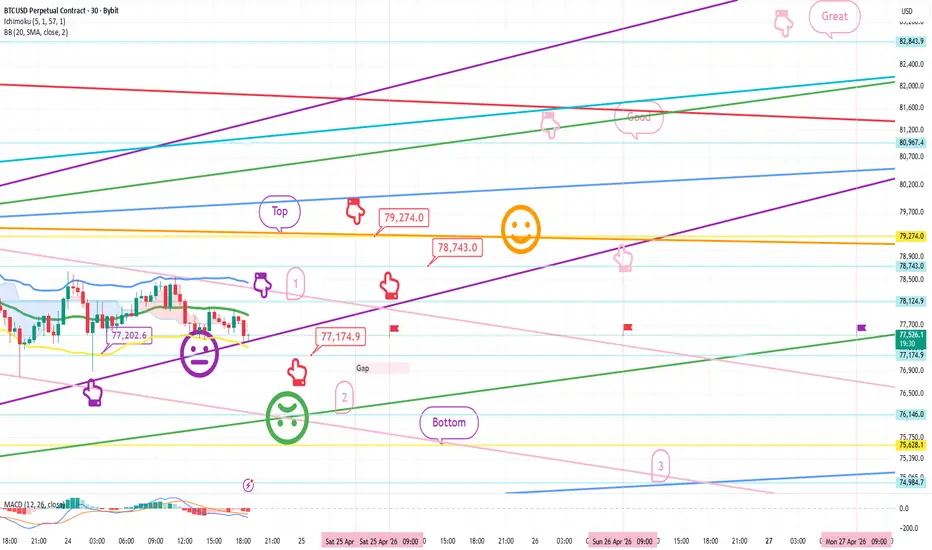
This is the Bitcoin 30-minute chart.
On the left, marked with the purple finger, I have connected the strategy exactly to the entry point of the long position I entered yesterday, 77.2K.
*The long position strategy is based on the time before and after touching section #1 marked with the purple finger at the top.
-Please pay close attention as there are many sections to explain today.
1) After confirming the touch of the purple finger at Zone 1 at the top,
At the bottom, the red finger indicates the entry zone for the $77,174.9 long position / Stop-loss price if the green support line is broken.
2) $79,274 long position 1st target -> Target prices in the order of Good, Great.
(If the rise is successful, refer to the expected path indicated by the pink finger in the middle.)
*If the price drops immediately without touching the purple finger at Zone 1:
At the bottom, Zone 2 indicates the entry zone for the $76.1K long position / Stop-loss price if the green support line is broken.
The stop-loss price is the same for those maintaining the $77.2K long position entered yesterday.
If the green support line at Zone 2 is broken,
the price may drop from the Bottom to Zone 3 over the weekend, so please exercise caution.
- Currently, a MACD dead cross is in progress on the 12-hour chart.
If the purple support line is maintained without breaking,
the warning signal will be ignored, and a vertical surge may occur.
Please use my analysis merely for reference and practical application.
I hope you operate safely by adhering to trading principles and strictly using stop-loss orders.
Thank you.
It's a Bitcoin Guide.
My analysis is optimized for TradingView.
If you press the Replay button, you can check real-time movements.
This is the Bitcoin 30-minute chart.
On the left, marked with the purple finger, I have connected the strategy exactly to the entry point of the long position I entered yesterday, 77.2K.
*The long position strategy is based on the time before and after touching section #1 marked with the purple finger at the top.
-Please pay close attention as there are many sections to explain today.
1) After confirming the touch of the purple finger at Zone 1 at the top,
At the bottom, the red finger indicates the entry zone for the $77,174.9 long position / Stop-loss price if the green support line is broken.
2) $79,274 long position 1st target -> Target prices in the order of Good, Great.
(If the rise is successful, refer to the expected path indicated by the pink finger in the middle.)
*If the price drops immediately without touching the purple finger at Zone 1:
At the bottom, Zone 2 indicates the entry zone for the $76.1K long position / Stop-loss price if the green support line is broken.
The stop-loss price is the same for those maintaining the $77.2K long position entered yesterday.
If the green support line at Zone 2 is broken,
the price may drop from the Bottom to Zone 3 over the weekend, so please exercise caution.
- Currently, a MACD dead cross is in progress on the 12-hour chart.
If the purple support line is maintained without breaking,
the warning signal will be ignored, and a vertical surge may occur.
Please use my analysis merely for reference and practical application.
I hope you operate safely by adhering to trading principles and strictly using stop-loss orders.
Thank you.
トレード終了: 利益確定目標に到達
Hello.This is the Bitcoin Guide.
Let's check the movements since the analysis post was written on April 24th.
This is the Bitcoin 30-minute chart.
I have marked the key zones with a black finger.
In the bottom left, I connected the strategy exactly at the entry point for the long position entered on the 23rd
(marked by the purple finger), $77,202.6.
*In the long position strategy (marked by the red finger),
after switching from a short position at the top (purple finger zone #1) to a long position at $77,174.9,
it touched the top zone of $79,274 without breaking the green support line.
The strategy was executed as a perfect take-profit.
After the new weekly and daily candles formed this week,
the New Gap zone that occurred last week was filled in one fell swoop.
It is currently consolidating after a strong correction,
but I will keep going strong today as well.
Thank you.

[Bitcoin Guide Affiliate]
*Bybit 20%DC Lifetime + $30,100
partner.bybit.com/b/Bitcoin_Guide
*BingX 50%DC + $14,100
bit.ly/3E8ZkAW
*ZeroMarket ECN 40%DC
bit.ly/3pY0dUv
*Telegram
t.me/bitcoinguide_TM
*Bybit 20%DC Lifetime + $30,100
partner.bybit.com/b/Bitcoin_Guide
*BingX 50%DC + $14,100
bit.ly/3E8ZkAW
*ZeroMarket ECN 40%DC
bit.ly/3pY0dUv
*Telegram
t.me/bitcoinguide_TM
関連の投稿
免責事項
これらの情報および投稿は、TradingViewが提供または承認する金融、投資、取引、またはその他の種類の助言もしくは推奨であることを意図したものではなく、またこれらに該当するものでもありません。詳細は利用規約をご覧ください。
[Bitcoin Guide Affiliate]
*Bybit 20%DC Lifetime + $30,100
partner.bybit.com/b/Bitcoin_Guide
*BingX 50%DC + $14,100
bit.ly/3E8ZkAW
*ZeroMarket ECN 40%DC
bit.ly/3pY0dUv
*Telegram
t.me/bitcoinguide_TM
*Bybit 20%DC Lifetime + $30,100
partner.bybit.com/b/Bitcoin_Guide
*BingX 50%DC + $14,100
bit.ly/3E8ZkAW
*ZeroMarket ECN 40%DC
bit.ly/3pY0dUv
*Telegram
t.me/bitcoinguide_TM
関連の投稿
免責事項
これらの情報および投稿は、TradingViewが提供または承認する金融、投資、取引、またはその他の種類の助言もしくは推奨であることを意図したものではなく、またこれらに該当するものでもありません。詳細は利用規約をご覧ください。