
Hello
It's a Bitcoinguide.
If you have a "follower"
You can receive comment notifications on real-time travel routes and major sections.
If my analysis is helpful,
I would like one booster button at the bottom, please.

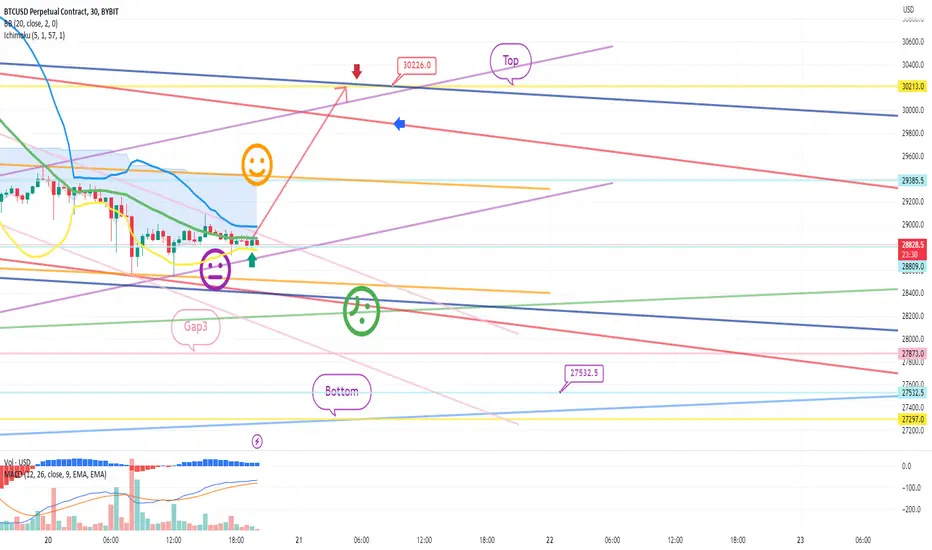
Bitcoin 30 minute chart.
It is a one-way long position strategy.
We will continue the same strategy as yesterday.
Instead, it's because it's a chaser in such a dangerous place.
I will hold on tight to the stop loss.
There is a Nasdaq indicator announcement tonight at 9:30, so please refer to it.
*At the red arrow path
long position strategy
1. Entry into long position at 28,809 / Stop loss when breaking the purple support line
$29385.5 1st target -> $30226 2nd target
Because there is a high possibility of sideways movement within the orange parallel line
Please pay attention to the strong rebound following the Nasdaq movement.
My analysis is for reference only.
I hope you operate safely with principle trading / stop loss essential.
thank you
It's a Bitcoinguide.
If you have a "follower"
You can receive comment notifications on real-time travel routes and major sections.
If my analysis is helpful,
I would like one booster button at the bottom, please.
Bitcoin 30 minute chart.
It is a one-way long position strategy.
We will continue the same strategy as yesterday.
Instead, it's because it's a chaser in such a dangerous place.
I will hold on tight to the stop loss.
There is a Nasdaq indicator announcement tonight at 9:30, so please refer to it.
*At the red arrow path
long position strategy
1. Entry into long position at
28,809 / Stop loss when breaking the purple support line$29385.5 1st target -> $30226 2nd target
Because there is a high possibility of sideways movement within the orange parallel line
Please pay attention to the strong rebound following the Nasdaq movement.
My analysis is for reference only.
I hope you operate safely with principle trading / stop loss essential.
thank you
トレード終了: ストップロスに到達
Helloit's a BitcoinGuide.
This is the movement after writing the NASDAQ analysis article.
The major sections were marked with a black finger.
arrow path
12948.1 after entering long position -> 13087.6 target reached
After that, it fell back to near the purple support line.
The last adjustment came out strong, but
The strategy worked perfectly.
This is the movement after writing the Bitcoin analysis article.
The major sections were marked with a black finger.
on the arrow path
Stop loss while completely breaking the purple support line
indicated,
It is moving sideways near the green support line.
It held up well, but following the Nasdaq movement
It is gradually falling to the right.
At the bottom, the last Gap3 section and
$27532.5 (midpoint of this week's downtrend -> next 25K)
It remains.
Nasdaq looks like it will continue to shake
Let's look at it as a whole.
I'll see you in a minute.
thank you

[Bitcoin Guide Affiliate]
*Bybit 20%DC Lifetime + $30,100
partner.bybit.com/b/Bitcoin_Guide
*BingX 50%DC + $14,100
bit.ly/3E8ZkAW
*ZeroMarket ECN 40%DC
bit.ly/3pY0dUv
*Telegram
t.me/bitcoinguide_TM
*Bybit 20%DC Lifetime + $30,100
partner.bybit.com/b/Bitcoin_Guide
*BingX 50%DC + $14,100
bit.ly/3E8ZkAW
*ZeroMarket ECN 40%DC
bit.ly/3pY0dUv
*Telegram
t.me/bitcoinguide_TM
関連の投稿
免責事項
これらの情報および投稿は、TradingViewが提供または承認する金融、投資、取引、またはその他の種類の助言もしくは推奨であることを意図したものではなく、またこれらに該当するものでもありません。詳細は利用規約をご覧ください。
[Bitcoin Guide Affiliate]
*Bybit 20%DC Lifetime + $30,100
partner.bybit.com/b/Bitcoin_Guide
*BingX 50%DC + $14,100
bit.ly/3E8ZkAW
*ZeroMarket ECN 40%DC
bit.ly/3pY0dUv
*Telegram
t.me/bitcoinguide_TM
*Bybit 20%DC Lifetime + $30,100
partner.bybit.com/b/Bitcoin_Guide
*BingX 50%DC + $14,100
bit.ly/3E8ZkAW
*ZeroMarket ECN 40%DC
bit.ly/3pY0dUv
*Telegram
t.me/bitcoinguide_TM
関連の投稿
免責事項
これらの情報および投稿は、TradingViewが提供または承認する金融、投資、取引、またはその他の種類の助言もしくは推奨であることを意図したものではなく、またこれらに該当するものでもありません。詳細は利用規約をご覧ください。