
Hello trader Today I have prepared a new idea for you. Like and subscribe to the channel there is a lot of useful information✅
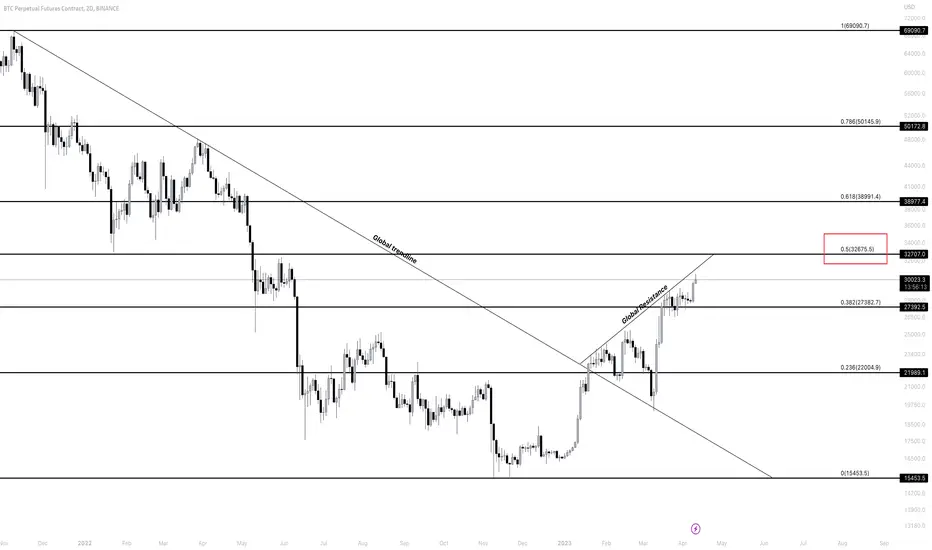
Friends, I can congratulate everyone who was waiting for the long-awaited figure of 30,000 for bitcoin!
The technical chart looks like a continuation of the upward movement, to the range of 31,450 this level represents resistance from which a small correction may follow, or a stronger resistance level of
  32,750 to which bitcoin can easily reach and from there we will see a strong correction.
Also today, a number of US macroeconomic data are being released from which there will be increased volatility:
▫️CPI data 15:30 GMT.
▫️FOMC minutes 21:00 GMT.
So do not relax much, especially those who are in Long positions, they will take out in both directions, I advise you to incur a stop plus or at no loss.
Friends, I can congratulate everyone who was waiting for the long-awaited figure of
30,000 for bitcoin!The technical chart looks like a continuation of the upward movement, to the range of
31,450 this level represents resistance from which a small correction may follow, or a stronger resistance level of 32,750 to which bitcoin can easily reach and from there we will see a strong correction.Also today, a number of US macroeconomic data are being released from which there will be increased volatility:
▫️CPI data 15:30 GMT.
▫️FOMC minutes 21:00 GMT.
So do not relax much, especially those who are in Long positions, they will take out in both directions, I advise you to incur a stop plus or at no loss.

関連の投稿
免責事項
これらの情報および投稿は、TradingViewが提供または承認する金融、投資、取引、またはその他の種類の助言もしくは推奨であることを意図したものではなく、またこれらに該当するものでもありません。詳細は利用規約をご覧ください。
免責事項
これらの情報および投稿は、TradingViewが提供または承認する金融、投資、取引、またはその他の種類の助言もしくは推奨であることを意図したものではなく、またこれらに該当するものでもありません。詳細は利用規約をご覧ください。