
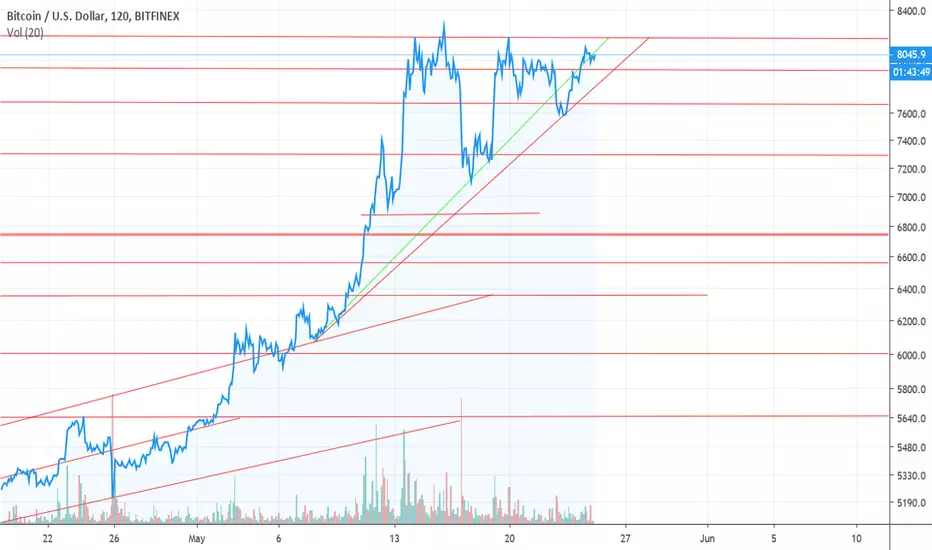
It appears as though Bitcoin is going to finish this pattern by the end of the weekend.
In one of my previous posts on Bitcoin i talked about the upward sloping trendline & how every time #BTC has traded on it since April / May, technically even further but not on this chart, we've seen parabolic movement, and we seen just that.
I've adjusted the line slightly in this chart, the Green line is where it was previously, and you can see Bitcoin is forming what I call a Wu Tang pattern, or simply a W.
Time will tell per usual.
In one of my previous posts on Bitcoin i talked about the upward sloping trendline & how every time #BTC has traded on it since April / May, technically even further but not on this chart, we've seen parabolic movement, and we seen just that.
I've adjusted the line slightly in this chart, the Green line is where it was previously, and you can see Bitcoin is forming what I call a Wu Tang pattern, or simply a W.
Time will tell per usual.

関連の投稿
免責事項
これらの情報および投稿は、TradingViewが提供または承認する金融、投資、取引、またはその他の種類の助言もしくは推奨であることを意図したものではなく、またこれらに該当するものでもありません。詳細は利用規約をご覧ください。
免責事項
これらの情報および投稿は、TradingViewが提供または承認する金融、投資、取引、またはその他の種類の助言もしくは推奨であることを意図したものではなく、またこれらに該当するものでもありません。詳細は利用規約をご覧ください。