
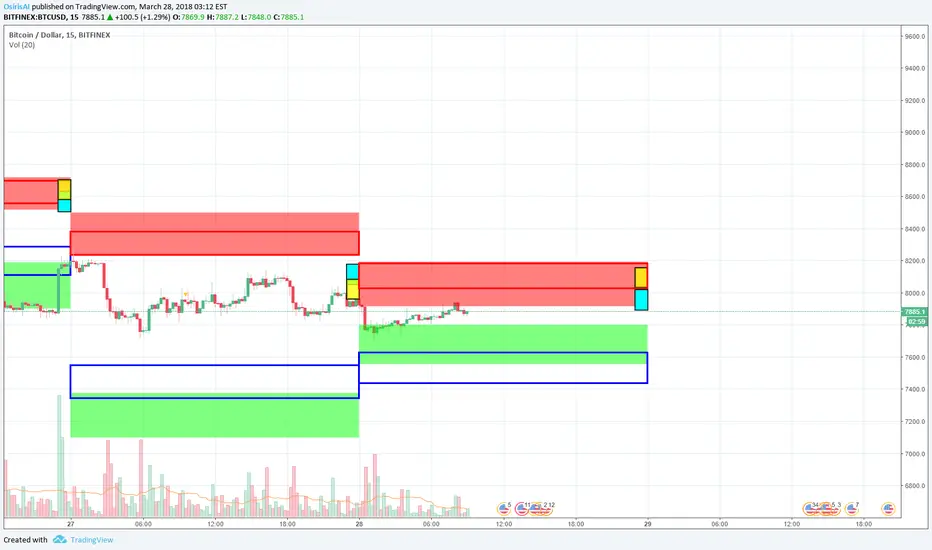
Daily forecast for BTC (BITFINEX) MIN and MAX of the day based on machine learning tools.
_____________________________________________________________________________
Comments:
Hello colleagues!
Good news: today will be an ordinary boring day
_____________________________________________________________________________
Description:
Red rectangles in the upper part indicate an area where, according to the forecast, the daily maximum will be located.
The green rectangles at the bottom indicate an area where, according to the forecast, the daily minimum will be located.
Rectangles allocated by faces have a similar meaning, but they are the result of the forecast of the second model.
Two squares at the end of the day - the forecast "Close" of the day.
Also: two colors - two models.
_____________________________________________________________________________
Comments:
Hello colleagues!
Good news: today will be an ordinary boring day
_____________________________________________________________________________
Description:
Red rectangles in the upper part indicate an area where, according to the forecast, the daily maximum will be located.
The green rectangles at the bottom indicate an area where, according to the forecast, the daily minimum will be located.
Rectangles allocated by faces have a similar meaning, but they are the result of the forecast of the second model.
Two squares at the end of the day - the forecast "Close" of the day.
Also: two colors - two models.

関連の投稿
免責事項
これらの情報および投稿は、TradingViewが提供または承認する金融、投資、取引、またはその他の種類の助言もしくは推奨であることを意図したものではなく、またこれらに該当するものでもありません。詳細は利用規約をご覧ください。
免責事項
これらの情報および投稿は、TradingViewが提供または承認する金融、投資、取引、またはその他の種類の助言もしくは推奨であることを意図したものではなく、またこれらに該当するものでもありません。詳細は利用規約をご覧ください。