
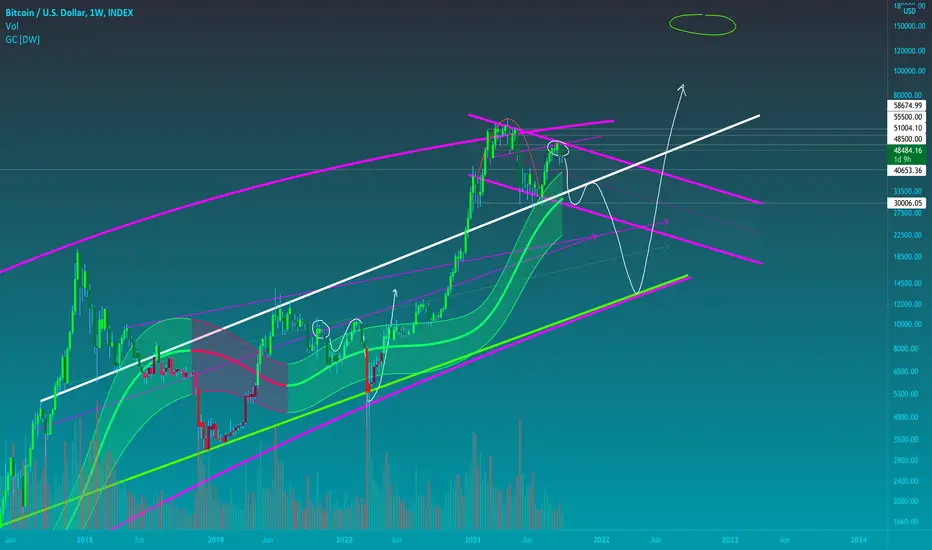
Using the channel indicator on a logarithmic scale, you can see strong similarity of our current bull run vs 2019 bull run.
After first large dump, market bounces off top of channel and uses it as support.
Following this, it bounces off the 50% line within the channel and heads to a strong resistance on a trend line (white one)
We then see a dump through the bottom of the channel which then lands on a strong logarithmic curve line(thick purple) and a logarithmic trend line(thick green)
After this, the bottom is set and a new bull run can commence. Target at 100k plus.
After first large dump, market bounces off top of channel and uses it as support.
Following this, it bounces off the 50% line within the channel and heads to a strong resistance on a trend line (white one)
We then see a dump through the bottom of the channel which then lands on a strong logarithmic curve line(thick purple) and a logarithmic trend line(thick green)
After this, the bottom is set and a new bull run can commence. Target at 100k plus.

免責事項
これらの情報および投稿は、TradingViewが提供または承認する金融、投資、取引、またはその他の種類の助言もしくは推奨であることを意図したものではなく、またこれらに該当するものでもありません。詳細は利用規約をご覧ください。
免責事項
これらの情報および投稿は、TradingViewが提供または承認する金融、投資、取引、またはその他の種類の助言もしくは推奨であることを意図したものではなく、またこれらに該当するものでもありません。詳細は利用規約をご覧ください。