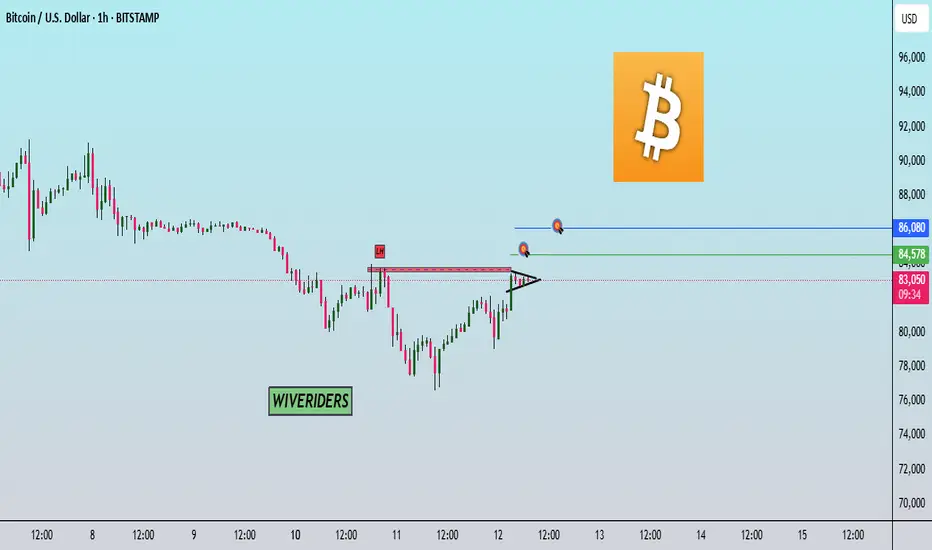
📊 BBTC/USDT Market Update – Key Resistance Test & Bullish Pattern
📈 BTC is now testing the red resistance zone, which aligns with the previous Lower High (LH). The price is also forming a bullish pattern, indicating potential breakout momentum.
🔄 If BTC successfully breaks above this resistance:
First target: Green line level.
Second target: Blue line level (previous resistance zone).
📌 Failure to break the red zone may lead to a pullback before another breakout attempt.
📈
BTC is now testing the red resistance zone, which aligns with the previous Lower High (LH). The price is also forming a bullish pattern, indicating potential breakout momentum.🔄 If BTC successfully breaks above this resistance:
First target: Green line level.
Second target: Blue line level (previous resistance zone).
📌 Failure to break the red zone may lead to a pullback before another breakout attempt.

免責事項
これらの情報および投稿は、TradingViewが提供または承認する金融、投資、取引、またはその他の種類の助言もしくは推奨であることを意図したものではなく、またこれらに該当するものでもありません。詳細は利用規約をご覧ください。
免責事項
これらの情報および投稿は、TradingViewが提供または承認する金融、投資、取引、またはその他の種類の助言もしくは推奨であることを意図したものではなく、またこれらに該当するものでもありません。詳細は利用規約をご覧ください。