
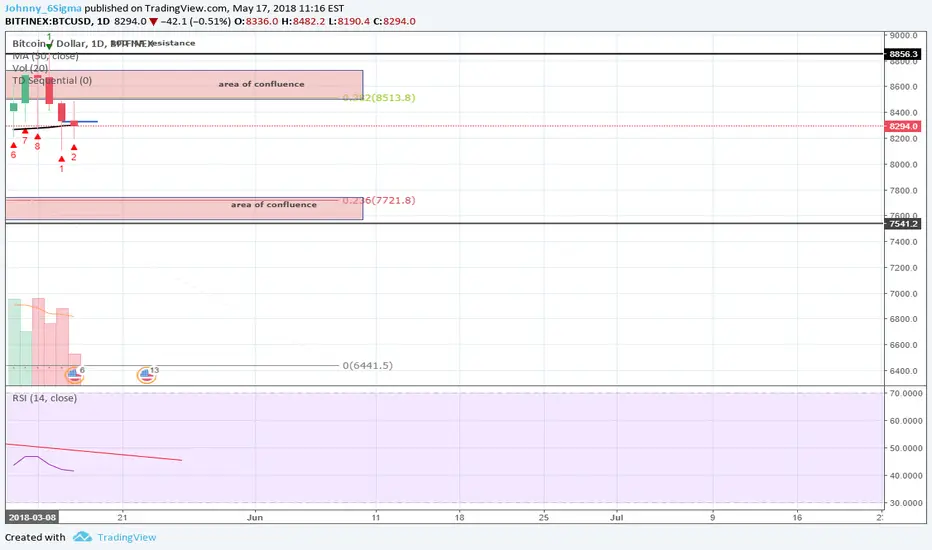
- We have a red 2 trading below a red 1. This indicates we have a high probability of further bearish daily price action. If we close today above the yesterday this is reduces the probability of bearish action, and have a higher chance of a reversal. As of now, the chances of 1-2 more days or either bearish or sideways movement is higher than a reversal to the upside.
- 50 day moving average (black) is supportive to the price.
- If we break though the 50 day moving average the target price will be around $7800.
- We have 2 areas of confluence. Resistant: $8500-$8725 Supportive: $7570-7735. If we break through either area of confluence, the chances of quicker movement is high.
- The RSI shows a sight oversell.
- Considering the current doji candle people are uncertain right now. In my opinion the signs of bearish movement is higher than bullish movement. We will see how it plays out.
I will update this through out the day.
ノート
It's been confirmed that the Red 2 has been trading below the Red 1. Now, we can expect 1-2 days of bearish/consolidation trend.
If today (red 3 ) continues to trade below yesterday, and it closes below yesterday the probability of 2 more days of downward/consolidated movement is high.
The price easily broke through the 50 day MA, so now hitting the supportive area of confluence is feasible.

免責事項
これらの情報および投稿は、TradingViewが提供または承認する金融、投資、取引、またはその他の種類の助言もしくは推奨であることを意図したものではなく、またこれらに該当するものでもありません。詳細は利用規約をご覧ください。
免責事項
これらの情報および投稿は、TradingViewが提供または承認する金融、投資、取引、またはその他の種類の助言もしくは推奨であることを意図したものではなく、またこれらに該当するものでもありません。詳細は利用規約をご覧ください。