
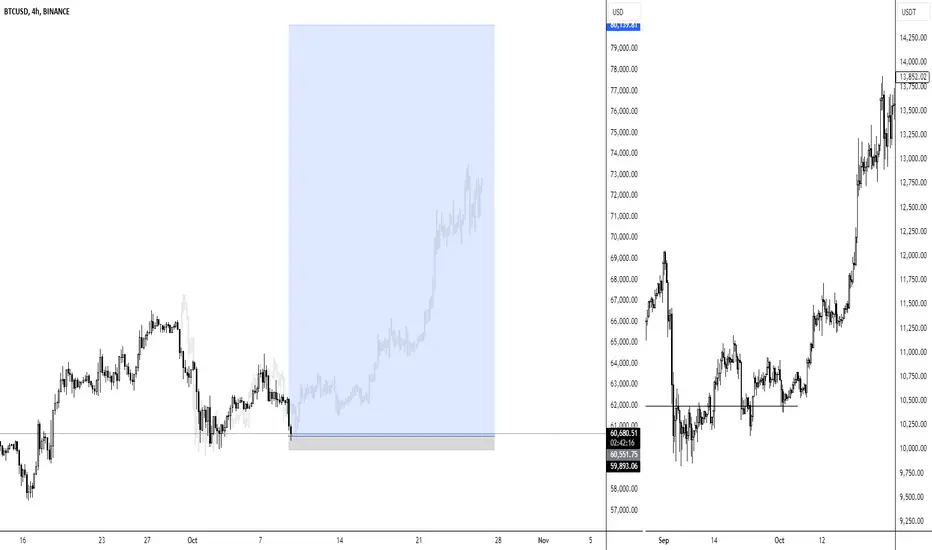
The chart right presents the pre bullmarket btc chart in 2020.
Strategy:
Potential long setup from the consolidation zone. The price action indicates a demand zone around the current levels, with a potential for reversal towards higher levels, as shown in the shaded blue area. The right-hand chart supports this bullish bias.
Entry: Around the current price levels (consolidation)
Stop-loss: Below the local support (recent swing low)
Risk management is essential, considering the current volatility and broader market correlation.
Strategy:
Potential long setup from the consolidation zone. The price action indicates a demand zone around the current levels, with a potential for reversal towards higher levels, as shown in the shaded blue area. The right-hand chart supports this bullish bias.
Entry: Around the current price levels (consolidation)
Stop-loss: Below the local support (recent swing low)
Risk management is essential, considering the current volatility and broader market correlation.
ノート
Wait for CPI to put a trade on, today. Don't take the trade blindly as it is not active yet.
💎💎- Professional Trader
💎💎 - Discord: discord.gg/gHKNVMyEvd
💎💎 - Trading Course: liquiditysweep369.carrd.co/
💎💎 - Discord: discord.gg/gHKNVMyEvd
💎💎 - Trading Course: liquiditysweep369.carrd.co/
免責事項
これらの情報および投稿は、TradingViewが提供または承認する金融、投資、取引、またはその他の種類の助言もしくは推奨であることを意図したものではなく、またこれらに該当するものでもありません。詳細は利用規約をご覧ください。
💎💎- Professional Trader
💎💎 - Discord: discord.gg/gHKNVMyEvd
💎💎 - Trading Course: liquiditysweep369.carrd.co/
💎💎 - Discord: discord.gg/gHKNVMyEvd
💎💎 - Trading Course: liquiditysweep369.carrd.co/
免責事項
これらの情報および投稿は、TradingViewが提供または承認する金融、投資、取引、またはその他の種類の助言もしくは推奨であることを意図したものではなく、またこれらに該当するものでもありません。詳細は利用規約をご覧ください。