
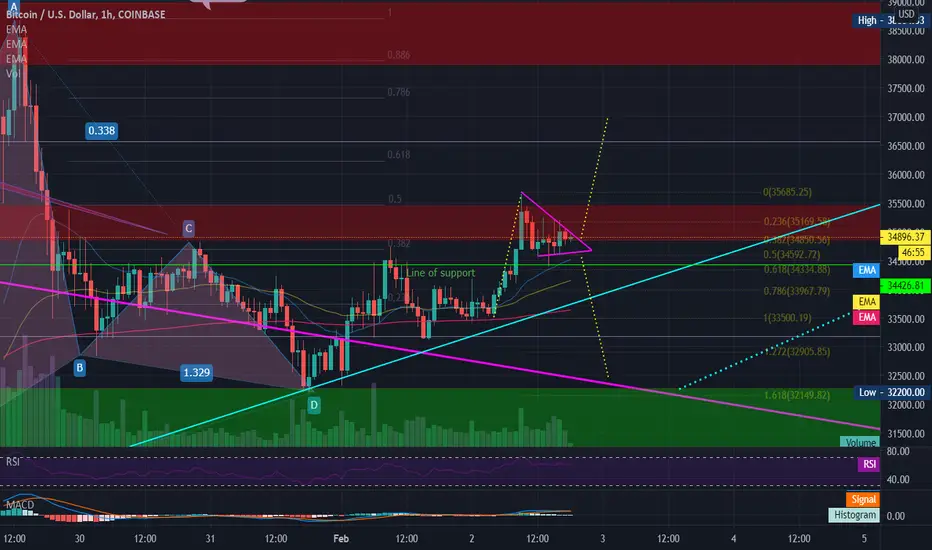
Looking at the 1hr chart it looks like Bitcoin has been rounding up it's pups and is ready to make a break for it.
The measured move up would give us a target above the red resistance box. I'll be looking for a back test to flip it to support if we get up above $35,500 again.
If we break down then I will be looking at several areas for support, the first being the .5 to .618 Fib retrace of the last move. About $32,200 would be my target for the downside and I'd be looking for a hard bounce from there.
Here is the daily chart. Is that an inverted head and shoulders?

If you twist my whiskers I'll admit my bullish bias.
The trend is our friend until it ends!
Owhooooo!
The measured move up would give us a target above the red resistance box. I'll be looking for a back test to flip it to support if we get up above $35,500 again.
If we break down then I will be looking at several areas for support, the first being the .5 to .618 Fib retrace of the last move. About $32,200 would be my target for the downside and I'd be looking for a hard bounce from there.
Here is the daily chart. Is that an inverted head and shoulders?
If you twist my whiskers I'll admit my bullish bias.
The trend is our friend until it ends!
Owhooooo!
ノート
RAOWFF! ノート
A back test on the 4hr (or 1hr) or a continuation of the measured move?ノート
The very rare Sleeping Dragon...we all know what happens when it awakens! Owhooooo!
ノート
ノート
The dragon is awake! $37,900 I think is the next stop!
免責事項
これらの情報および投稿は、TradingViewが提供または承認する金融、投資、取引、またはその他の種類の助言もしくは推奨であることを意図したものではなく、またこれらに該当するものでもありません。詳細は利用規約をご覧ください。
免責事項
これらの情報および投稿は、TradingViewが提供または承認する金融、投資、取引、またはその他の種類の助言もしくは推奨であることを意図したものではなく、またこれらに該当するものでもありません。詳細は利用規約をご覧ください。