
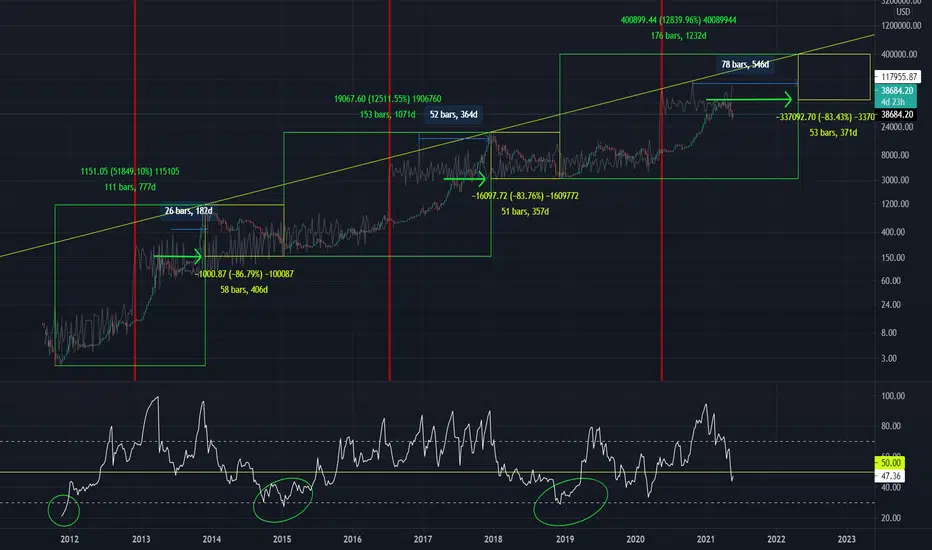
S2F model shows bitcoin is still on track.
Also, we see that this cycle has repeated after each halving (red lines).
At each mid cycle top (there has now been three) we see that it also represents the next cycle low.
Another thing to note are the peaks in the S2F model AFTER each halving; they show where the price will reach BEFORE the Blow-Off-Top
Act Accordingly
Also, we see that this cycle has repeated after each halving (red lines).
At each mid cycle top (there has now been three) we see that it also represents the next cycle low.
Another thing to note are the peaks in the S2F model AFTER each halving; they show where the price will reach BEFORE the Blow-Off-Top
Act Accordingly
ノート
This guy stole my idea. youtube.com/watch?v=PR6QJV4taJU

免責事項
これらの情報および投稿は、TradingViewが提供または承認する金融、投資、取引、またはその他の種類の助言もしくは推奨であることを意図したものではなく、またこれらに該当するものでもありません。詳細は利用規約をご覧ください。
免責事項
これらの情報および投稿は、TradingViewが提供または承認する金融、投資、取引、またはその他の種類の助言もしくは推奨であることを意図したものではなく、またこれらに該当するものでもありません。詳細は利用規約をご覧ください。