
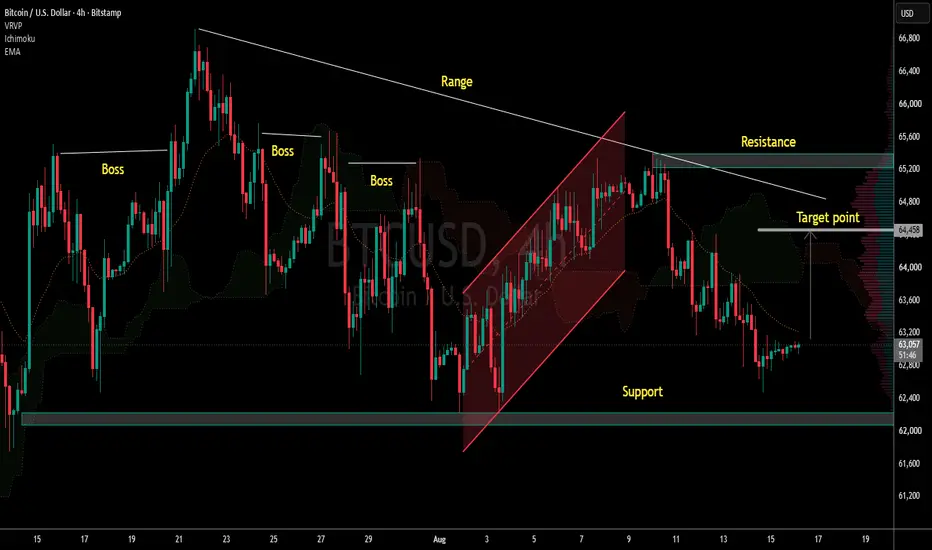
This is the Bitcoin / U.S. Dollar - BTCUSD 4-Hour chart on Bitstamp with manual levels marked.
Chart Analysis:
1. Range + Descending Trend: BTC has been trading in a big range. A descending "Range" trendline is coming down from the ∼$66,400 highs.
2. Failed Breakout: Price made a pink rising channel, broke up to test "Resistance" near $65,200, then got rejected hard.
3. Current Price: Now trading at ∼$62,600 - right above the major "Support" zone at $62,000 - $62,200. That's a key area marked on chart.
4. Structure: Multiple "Boss" supply zones were marked earlier. We failed at resistance and now in a pullback. "Target point" is marked around $64,000 if it bounces.
Key Levels to Watch:
- Resistance: $64,800 - $65,200 - Recent high + descending trendline. Break above needed for bullish continuation
- Support 1: $62,000 - $62,200 - Major horizontal support. Must hold for bulls
- Support 2: $61,000 - If $62K breaks, next downside target
Bias: Short-term bearish pressure while below $65,200. Holding $62,000 keeps the range alive. Losing $62,000 on 4H close likely sends BTC to test $61,000. Bounce from here could target the "Target point" at ∼$64,000.
Educational only. Not financial advice. Always manage risk
Chart Analysis:
1. Range + Descending Trend: BTC has been trading in a big range. A descending "Range" trendline is coming down from the ∼$66,400 highs.
2. Failed Breakout: Price made a pink rising channel, broke up to test "Resistance" near $65,200, then got rejected hard.
3. Current Price: Now trading at ∼$62,600 - right above the major "Support" zone at $62,000 - $62,200. That's a key area marked on chart.
4. Structure: Multiple "Boss" supply zones were marked earlier. We failed at resistance and now in a pullback. "Target point" is marked around $64,000 if it bounces.
Key Levels to Watch:
- Resistance: $64,800 - $65,200 - Recent high + descending trendline. Break above needed for bullish continuation
- Support 1: $62,000 - $62,200 - Major horizontal support. Must hold for bulls
- Support 2: $61,000 - If $62K breaks, next downside target
Bias: Short-term bearish pressure while below $65,200. Holding $62,000 keeps the range alive. Losing $62,000 on 4H close likely sends BTC to test $61,000. Bounce from here could target the "Target point" at ∼$64,000.
Educational only. Not financial advice. Always manage risk
トレード稼働中
active
t.me/+iZwBzq15KTM1Mzc0
join telegram for free signal on gold and different markets
t.me/+iZwBzq15KTM1Mzc0
join free telegram channel
join telegram for free signal on gold and different markets
t.me/+iZwBzq15KTM1Mzc0
join free telegram channel
関連の投稿
免責事項
これらの情報および投稿は、TradingViewが提供または承認する金融、投資、取引、またはその他の種類の助言もしくは推奨であることを意図したものではなく、またこれらに該当するものでもありません。詳細は利用規約をご覧ください。
t.me/+iZwBzq15KTM1Mzc0
join telegram for free signal on gold and different markets
t.me/+iZwBzq15KTM1Mzc0
join free telegram channel
join telegram for free signal on gold and different markets
t.me/+iZwBzq15KTM1Mzc0
join free telegram channel
関連の投稿
免責事項
これらの情報および投稿は、TradingViewが提供または承認する金融、投資、取引、またはその他の種類の助言もしくは推奨であることを意図したものではなく、またこれらに該当するものでもありません。詳細は利用規約をご覧ください。