
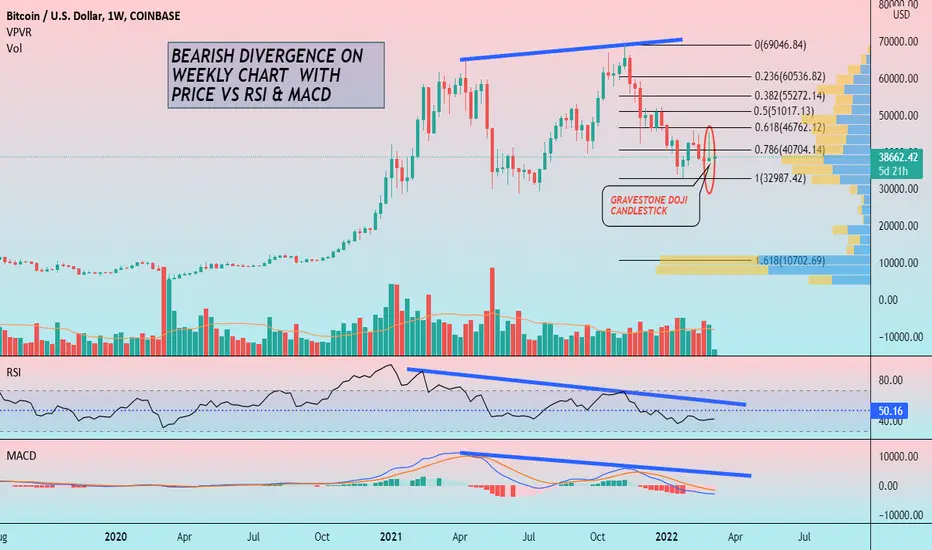
Hello friends, today you can review the technical analysis idea on a 1W linear scale chart for Bitcoin (BTCUSD).
The chart is self-explanatory. A recent Gravestone Doji Candlestick was printed indicating a bearish possible trend. There is also the concern with the bearish divergence comparing Price to RSI and MACD. Lastly, I showed the Fibonacci Retracement with the 1.618 level coming around $10K-$11K, which is also a heavy traded area on the VPVR.
This is the weekly chart so have some patience and until the chart shows something otherwise, the BTC price is looking bearish.
If you enjoy my ideas, feel free to like it and drop in a comment. I love reading your comments below.
Disclosure: This is just my opinion and not any type of financial advice. I enjoy charting and discussing technical analysis . Don't trade based on my advice. Do your own research! #cryptopickk
The chart is self-explanatory. A recent Gravestone Doji Candlestick was printed indicating a bearish possible trend. There is also the concern with the bearish divergence comparing Price to RSI and MACD. Lastly, I showed the Fibonacci Retracement with the 1.618 level coming around $10K-$11K, which is also a heavy traded area on the VPVR.
This is the weekly chart so have some patience and until the chart shows something otherwise, the BTC price is looking bearish.
If you enjoy my ideas, feel free to like it and drop in a comment. I love reading your comments below.
Disclosure: This is just my opinion and not any type of financial advice. I enjoy charting and discussing technical analysis . Don't trade based on my advice. Do your own research! #cryptopickk

関連の投稿
免責事項
これらの情報および投稿は、TradingViewが提供または承認する金融、投資、取引、またはその他の種類の助言もしくは推奨であることを意図したものではなく、またこれらに該当するものでもありません。詳細は利用規約をご覧ください。
免責事項
これらの情報および投稿は、TradingViewが提供または承認する金融、投資、取引、またはその他の種類の助言もしくは推奨であることを意図したものではなく、またこれらに該当するものでもありません。詳細は利用規約をご覧ください。