
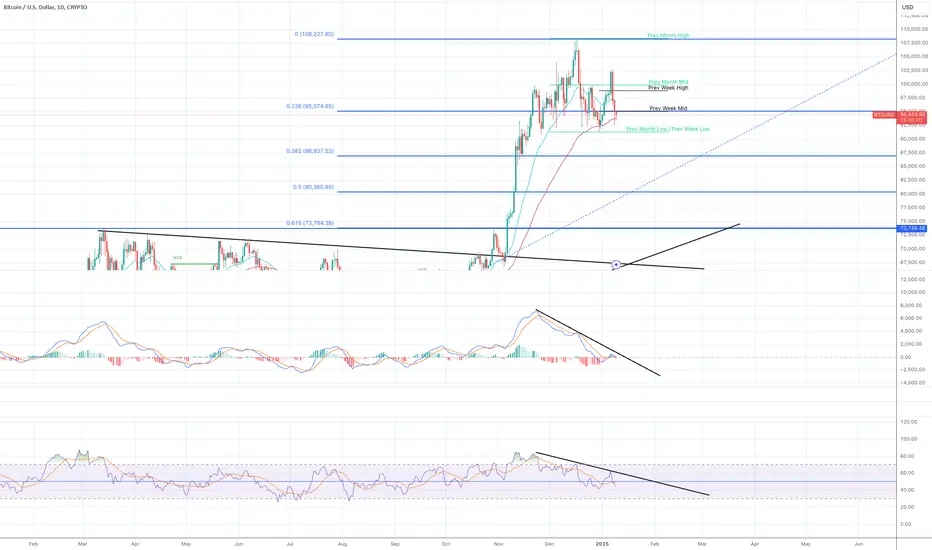
Bitcoin bull is trying hard to defend the previous month/week low around 91,000 region. If a daily candle closes below that line, all momentum indicators are likely to enter the bear territory. In that case, I have to accept the probability that the price can come down as low as 73,000 area (Fib 0.618).
But my bias for Bitcoin is still upside so I am going to wait for an entry position to buy more. I will wait for the daily MACD lines and RSI lines to cross and close above the descending trendlines in the bull territory. Horizontal lines are more reliable than ascending/descending trendlines on a price chart, but when I see clear highs and lows in the momentum indicators (4H, daily, and weekly), I draw a trendline and wait for the line to get broken. It often works really well to identify a good entry point.
But my bias for Bitcoin is still upside so I am going to wait for an entry position to buy more. I will wait for the daily MACD lines and RSI lines to cross and close above the descending trendlines in the bull territory. Horizontal lines are more reliable than ascending/descending trendlines on a price chart, but when I see clear highs and lows in the momentum indicators (4H, daily, and weekly), I draw a trendline and wait for the line to get broken. It often works really well to identify a good entry point.

関連の投稿
免責事項
これらの情報および投稿は、TradingViewが提供または承認する金融、投資、取引、またはその他の種類の助言もしくは推奨であることを意図したものではなく、またこれらに該当するものでもありません。詳細は利用規約をご覧ください。
免責事項
これらの情報および投稿は、TradingViewが提供または承認する金融、投資、取引、またはその他の種類の助言もしくは推奨であることを意図したものではなく、またこれらに該当するものでもありません。詳細は利用規約をご覧ください。