
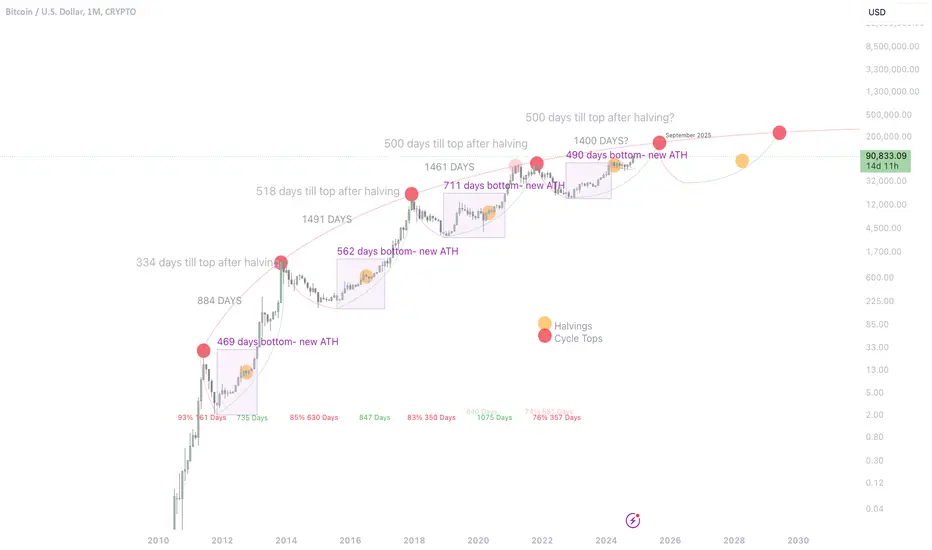
This chart highlights the remarkable consistency in Bitcoin's historical cycles, showcasing how price movements align across different cycles in terms of duration (days) and percentage changes. By visualizing these repeating patterns, you can gain valuable insights into Bitcoin's cyclical behavior and potential future trends.

免責事項
これらの情報および投稿は、TradingViewが提供または承認する金融、投資、取引、またはその他の種類の助言もしくは推奨であることを意図したものではなく、またこれらに該当するものでもありません。詳細は利用規約をご覧ください。
免責事項
これらの情報および投稿は、TradingViewが提供または承認する金融、投資、取引、またはその他の種類の助言もしくは推奨であることを意図したものではなく、またこれらに該当するものでもありません。詳細は利用規約をご覧ください。