
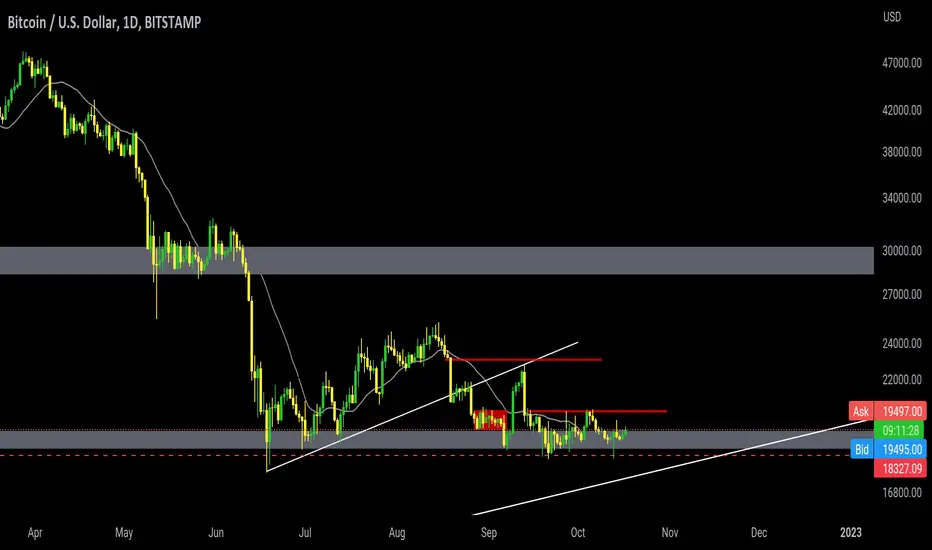
What can be seen in the chart, apart from the discussion of fundamentals, we are at the end of leg 2, and leg 2 overlaps with the break-even level, and these chats that occurred at the end of the trend can most likely be an extension Gap.
In general, this correction can be considered a pullback at the breakeven level (19,000).
But for more believers, it is possible to wait for the breakout trading range that has been specified. or looking for signal bars with good gap
The next reason is to approach the long-term trend line of the chart.

関連の投稿
免責事項
これらの情報および投稿は、TradingViewが提供または承認する金融、投資、取引、またはその他の種類の助言もしくは推奨であることを意図したものではなく、またこれらに該当するものでもありません。詳細は利用規約をご覧ください。
関連の投稿
免責事項
これらの情報および投稿は、TradingViewが提供または承認する金融、投資、取引、またはその他の種類の助言もしくは推奨であることを意図したものではなく、またこれらに該当するものでもありません。詳細は利用規約をご覧ください。