
Technical Analysis and Outlook:
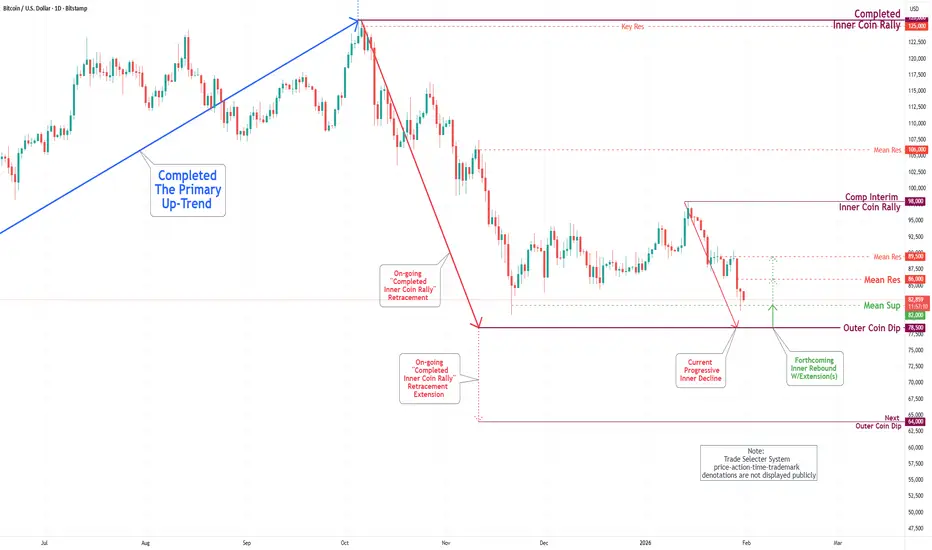
Bitcoin has undergone a significant decline during this week's trading session, resulting in the elimination of both the Mean Support levels at 85,300 and 82,000.
Current market analysis suggests a continued downward trajectory. Should Bitcoin breach the initial support level of Mean Support at 82.000, the immediate downside target will be our ultimate Outer Coin Dip at 78,500, followed by a subsequent target of the next Outer Coin Dip at 64,000.
On the upside, a rebound is anticipated upon reaching the Outer Coin Dip at 78,500. It is important to note that a gradual intermediate gyration may occur between the Mean Support at 82,000 and the Mean Resistance at 86,000 before the continuation of the downward trend.
Bitcoin has undergone a significant decline during this week's trading session, resulting in the elimination of both the Mean Support levels at 85,300 and 82,000.
Current market analysis suggests a continued downward trajectory. Should Bitcoin breach the initial support level of Mean Support at 82.000, the immediate downside target will be our ultimate Outer Coin Dip at 78,500, followed by a subsequent target of the next Outer Coin Dip at 64,000.
On the upside, a rebound is anticipated upon reaching the Outer Coin Dip at 78,500. It is important to note that a gradual intermediate gyration may occur between the Mean Support at 82,000 and the Mean Resistance at 86,000 before the continuation of the downward trend.

関連の投稿
免責事項
これらの情報および投稿は、TradingViewが提供または承認する金融、投資、取引、またはその他の種類の助言もしくは推奨であることを意図したものではなく、またこれらに該当するものでもありません。詳細は利用規約をご覧ください。
免責事項
これらの情報および投稿は、TradingViewが提供または承認する金融、投資、取引、またはその他の種類の助言もしくは推奨であることを意図したものではなく、またこれらに該当するものでもありません。詳細は利用規約をご覧ください。