
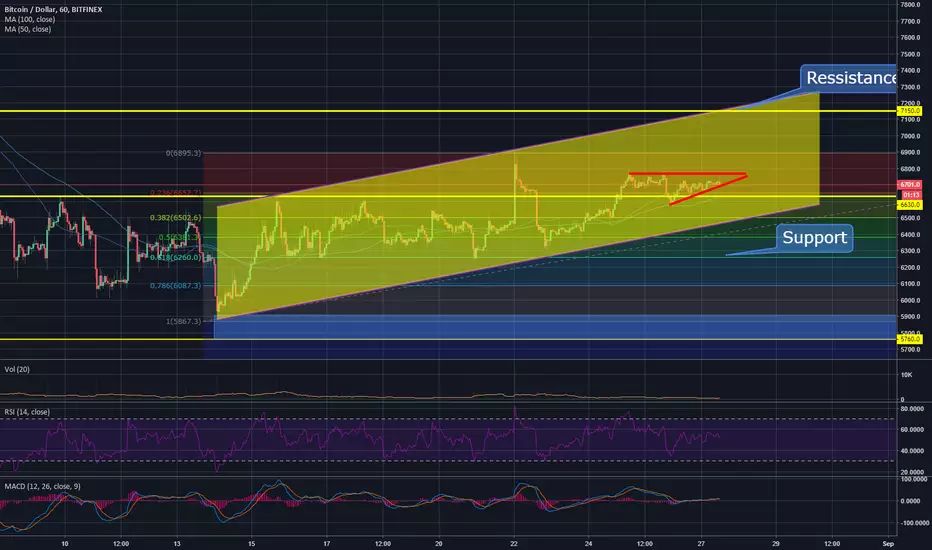
BTCUSD still looking bullish on 1h chart. Its moving nicely in an ascending channel (yellow) from the local bottom at $5900. We have Fib. 0.618 support at $6260 and the resistance at $7150 (last high). Usually gaps on the downside get filled in, before we get new confirmation of the trend (between yellow support/resistance levels). On 15 min chart BTC is building ascending triangle formation (red). If we get a break above that, I think the next leg could take us up to resistance at $7150 and opposite – break below that level would take us back to Fib. Support $6260. You can put stop loss just under and wait for confirmation.
We are far from any change of trend. The downside is still in play, I marked last support zone with blue and indicated $5760 being the last support. Even though we are still in bearish trend, Intraday trading still offer good opportunities, so adopt your timeframe accordingly.
We are far from any change of trend. The downside is still in play, I marked last support zone with blue and indicated $5760 being the last support. Even though we are still in bearish trend, Intraday trading still offer good opportunities, so adopt your timeframe accordingly.
ノート
We got a nice break from triangle. That was a great intraday entry point. Now pushing to upper ressistance. Close trade there and take profits.
免責事項
これらの情報および投稿は、TradingViewが提供または承認する金融、投資、取引、またはその他の種類の助言もしくは推奨であることを意図したものではなく、またこれらに該当するものでもありません。詳細は利用規約をご覧ください。
免責事項
これらの情報および投稿は、TradingViewが提供または承認する金融、投資、取引、またはその他の種類の助言もしくは推奨であることを意図したものではなく、またこれらに該当するものでもありません。詳細は利用規約をご覧ください。