
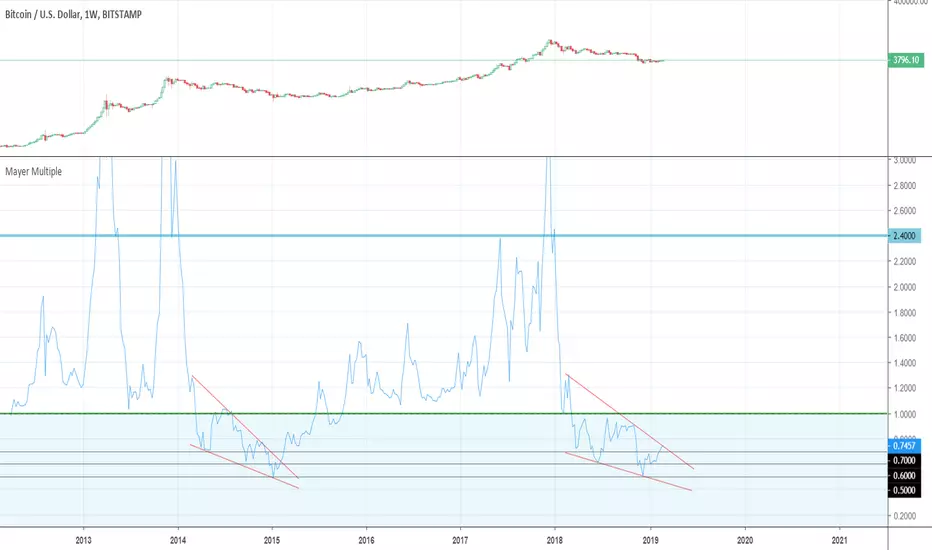
Hello! I am not a professional trader. I just like to look at the charts and try to find similarities over time. Recently I noticed a similar pattern for The Mayer Multiple (the multiple of the current Bitcoin price over the 200-days moving average). The time period and the bouncing levels (0.70, 0.60 and 0.50) look very similar for the years 2014-15 and 2018-19.

免責事項
これらの情報および投稿は、TradingViewが提供または承認する金融、投資、取引、またはその他の種類の助言もしくは推奨であることを意図したものではなく、またこれらに該当するものでもありません。詳細は利用規約をご覧ください。
免責事項
これらの情報および投稿は、TradingViewが提供または承認する金融、投資、取引、またはその他の種類の助言もしくは推奨であることを意図したものではなく、またこれらに該当するものでもありません。詳細は利用規約をご覧ください。