
#BTC (Update)
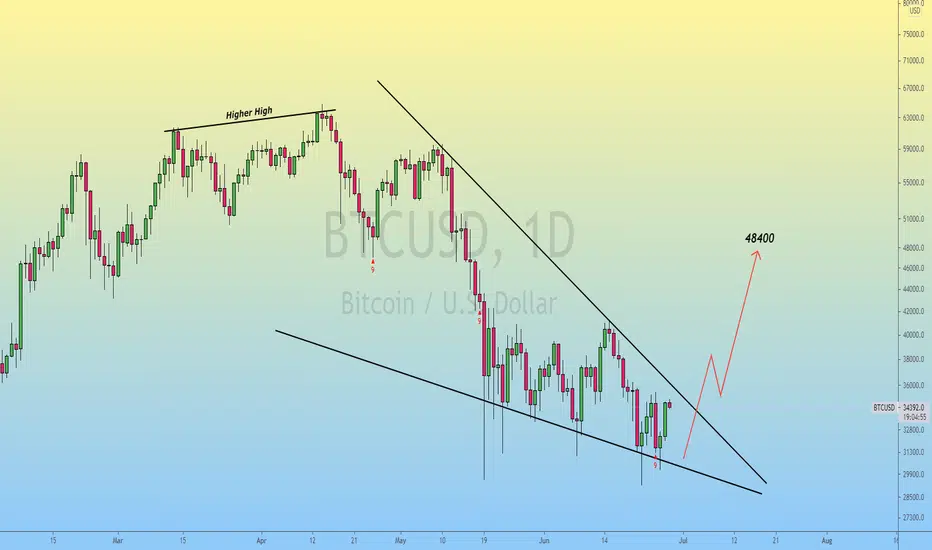
In daily timeframe Chart, Bitcoin is Forming Falling Wedge Pattern..!!
RSI Indicator is Printing Classical Bullish Divergence..
At the Moment, Bulls testing the Resistance 35k, If resistance got Cleared, Expecting Huge Bullish Wave towards the 48k in Coming Days.
In case of Rejection, Bitcoin Might Retest the 30k Area (Lower Low), If Daily Candle Closed Below the 29k, then Falling Wedge Pattern Will be invalid.
Please like the idea for Support & Subscribe for More ideas like this and share your ideas and charts in Comments Section..!!
Thanks for Your Love & Support..!!
In daily timeframe Chart, Bitcoin is Forming Falling Wedge Pattern..!!
RSI Indicator is Printing Classical Bullish Divergence..
At the Moment, Bulls testing the Resistance 35k, If resistance got Cleared, Expecting Huge Bullish Wave towards the 48k in Coming Days.
In case of Rejection, Bitcoin Might Retest the 30k Area (Lower Low), If Daily Candle Closed Below the 29k, then Falling Wedge Pattern Will be invalid.
Please like the idea for Support & Subscribe for More ideas like this and share your ideas and charts in Comments Section..!!
Thanks for Your Love & Support..!!

Follow me On Twitter & Telegram For More Regular Updates..!!
Public Telegram Channel:
t.me/CryptoCove
Forex Telegram Channel:
t.me/Captain_FX
Twitter:
twitter.com/CryptoFaibik
Instagram :
instagram.com/captain_faibik
Public Telegram Channel:
t.me/CryptoCove
Forex Telegram Channel:
t.me/Captain_FX
Twitter:
twitter.com/CryptoFaibik
Instagram :
instagram.com/captain_faibik
免責事項
これらの情報および投稿は、TradingViewが提供または承認する金融、投資、取引、またはその他の種類の助言もしくは推奨であることを意図したものではなく、またこれらに該当するものでもありません。詳細は利用規約をご覧ください。
Follow me On Twitter & Telegram For More Regular Updates..!!
Public Telegram Channel:
t.me/CryptoCove
Forex Telegram Channel:
t.me/Captain_FX
Twitter:
twitter.com/CryptoFaibik
Instagram :
instagram.com/captain_faibik
Public Telegram Channel:
t.me/CryptoCove
Forex Telegram Channel:
t.me/Captain_FX
Twitter:
twitter.com/CryptoFaibik
Instagram :
instagram.com/captain_faibik
免責事項
これらの情報および投稿は、TradingViewが提供または承認する金融、投資、取引、またはその他の種類の助言もしくは推奨であることを意図したものではなく、またこれらに該当するものでもありません。詳細は利用規約をご覧ください。