
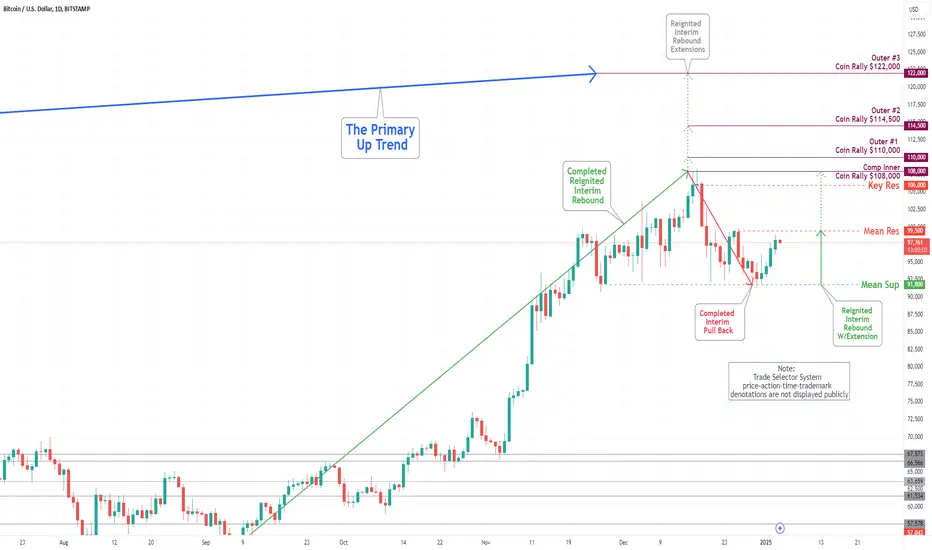
Technical Analysis and Outlook:
As specified in the Bitcoin Daily Chart Analysis for December 27, an extraordinary rebound bull movement occurred from the Mean Support of 91800. Current analysis suggests a high likelihood that the cryptocurrency will continue to advance, potentially testing the Mean Resistance level of 99500 and aiming for a retest of the completed Inner Coin Rally marked at 108000. Nevertheless, it is crucial to recognize the possibility of a pullback to retest the Mean Support level of 91800 again before any resurgence in the bull market.
As specified in the Bitcoin Daily Chart Analysis for December 27, an extraordinary rebound bull movement occurred from the Mean Support of 91800. Current analysis suggests a high likelihood that the cryptocurrency will continue to advance, potentially testing the Mean Resistance level of 99500 and aiming for a retest of the completed Inner Coin Rally marked at 108000. Nevertheless, it is crucial to recognize the possibility of a pullback to retest the Mean Support level of 91800 again before any resurgence in the bull market.

関連の投稿
免責事項
これらの情報および投稿は、TradingViewが提供または承認する金融、投資、取引、またはその他の種類の助言もしくは推奨であることを意図したものではなく、またこれらに該当するものでもありません。詳細は利用規約をご覧ください。
免責事項
これらの情報および投稿は、TradingViewが提供または承認する金融、投資、取引、またはその他の種類の助言もしくは推奨であることを意図したものではなく、またこれらに該当するものでもありません。詳細は利用規約をご覧ください。