
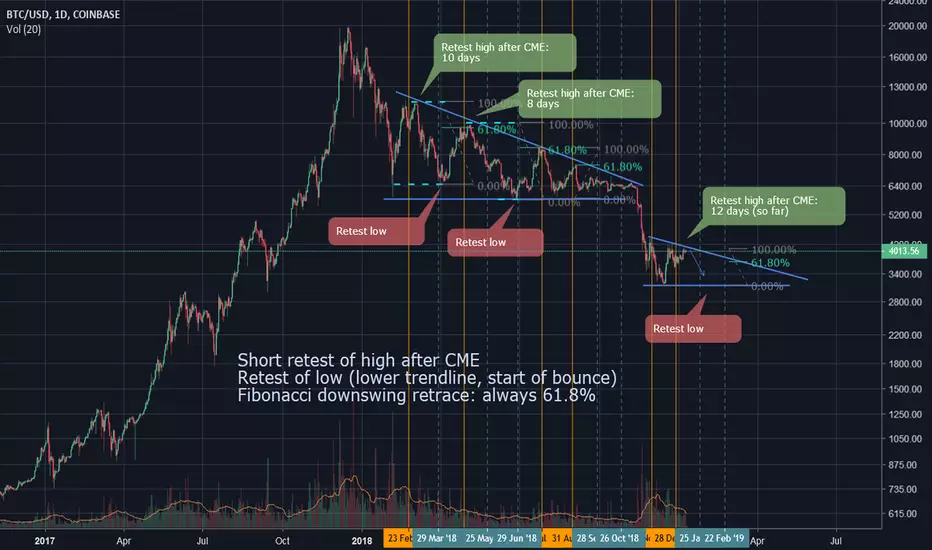
Continuing from my previous chart. Fibonacci downswing retrace is always 61.8%
- All vertical lines are the CME Bitcoin Futures expiry dates
- Each orange vertical line, shows a CME date that was preceded by a bounce
- Following those dates (orange), there is a short retest of the recent high
- The price then drops all the way back down to test the start of that bounce
- After testing the lower trendline, the downswing Fibonacci retrace is always 61.8% (to meet the upper trendline)
- This cycle repeats until the price breaks down to a lower plateau trendline

関連の投稿
免責事項
これらの情報および投稿は、TradingViewが提供または承認する金融、投資、取引、またはその他の種類の助言もしくは推奨であることを意図したものではなく、またこれらに該当するものでもありません。詳細は利用規約をご覧ください。
免責事項
これらの情報および投稿は、TradingViewが提供または承認する金融、投資、取引、またはその他の種類の助言もしくは推奨であることを意図したものではなく、またこれらに該当するものでもありません。詳細は利用規約をご覧ください。